
With spotlight on childhood adversity, new data offer finer-grained view

“So, what’s your ACEs score?”
The question might be meaningless to most today, but given the amount of attention currently being lavished on the concept of adverse childhood experiences (ACEs), it may be only a matter of time before childhood adversity scores are charted right next to cholesterol counts and blood pressure.
A conference held last week in San Francisco marked the continuing rise to prominence of childhood adversity as a key concept in children’s health and public health circles. The occasion was also used to spotlight a new report, fueled by four years worth of California data, that helps explain how childhood adversity plays out across class, race, education and geographic boundaries.
The new report, released by San Francisco-based Center for Youth Wellness, confirms earlier research documenting the long-term risks associated with childhood adversity, while providing a fuller look at which groups tend to be most vulnerable. Race tends not to be a huge factor, while income, education and geography are more tightly linked to levels of childhood adversity.
The term “adverse childhood experiences” gained currency from a landmark study published in 1998 by Dr. Vincent Felitti and Dr. Robert Anda. Based on a survey of more than 17,000 Kaiser Permanente patients in San Diego, the study found that adults were more likely to have problems such as alcoholism, drug abuse, morbid obesity, heart disease and cancer if they had been exposed as children to abuse and household dysfunction and that the more exposure, the higher likelihood of problems.
The data in the new report come from a broader pool than the Kaiser study, drawing on four years of statewide random phone surveys conducted by the California Behavioral Risk Factor Surveillance System. While the trends in the data mirror Felitti and Anda’s original work, some of the findings are starker, as the report makes clear:
The number of Californians who have experienced four or more ACEs [16.7 percent] is considerably higher than the finding from the original Kaiser study in which 12.5 percent, or one in eight, of the study participants experienced four or more ACEs.
As in the Kaiser Permanente study, the recent study found that the higher the number of ACEs you’ve experienced, the greater the chances you’re engaging in risky behaviors and the higher your risk for serious health conditions. Other research has found that a person with four or more ACEs is 12 times more likely to commit suicide, 10 times more likely to inject drugs and approximately twice as likely to have heart disease, stroke and cancer.
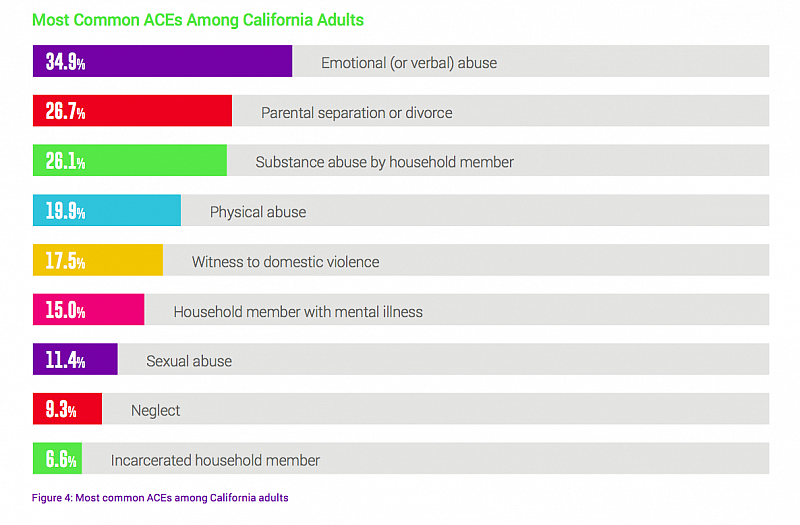
What are the most common ACEs in California? Emotional abuse leads the pack, followed by parental separation or divorce and substance abuse by someone in the household.
How does race play into childhood adversity? The data are largely consistent across racial lines when it comes to ACEs, except for Asians and Pacific Islanders. The prevalence of whites in California with four or more ACEs is 16.4 percent, while the rate for blacks is 16.5 percent. Latinos’ figures are just slightly higher at 17.3 percent, while Asians and Pacific Islanders are lower, with only 11.1 percent having four or more ACEs.
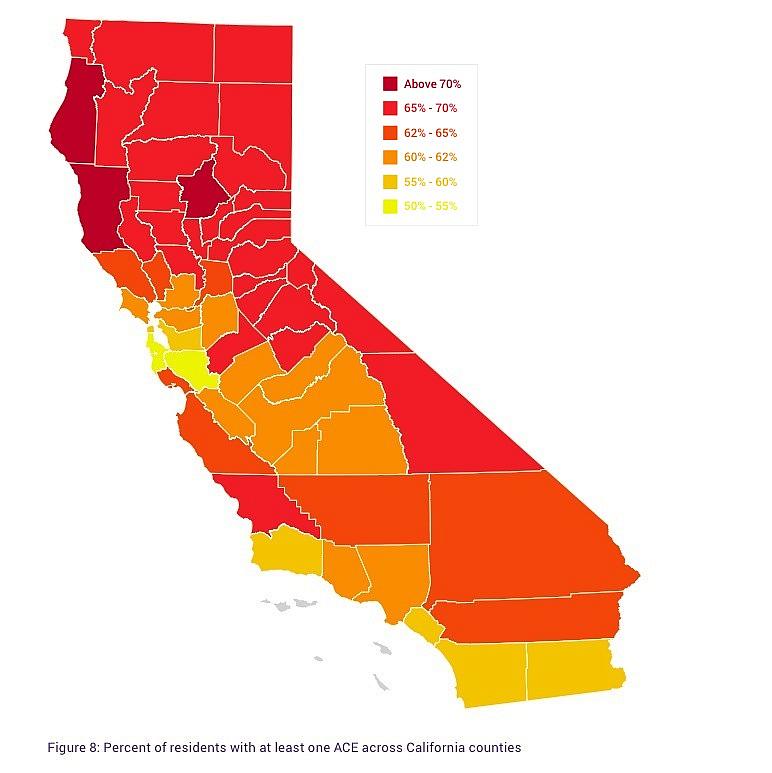
What about geography? There are wide geographic differences among counties throughout the state, a finding that researchers did not try to explain. Santa Clara and San Mateo counties have the lowest rates of residents with at least one ACE, and the Bay Area tends to have lower rates overall. Coastal counties and inland Imperial County have the best rates in the southern half of the state. At the other end of the spectrum, Humboldt, Mendocino and Butte counties in the far north lead the state, with more than 70 percent of those surveyed reporting at least one ACE.
(It’s worth noting that the data sets for some counties are very small, though the researchers say the findings are still statistically significant. For example, the four-year Butte County sample consists of a total of 249 individuals. Colusa, Glenn, Tehama and Lake counties were lumped together because only 206 people were surveyed over four years.)
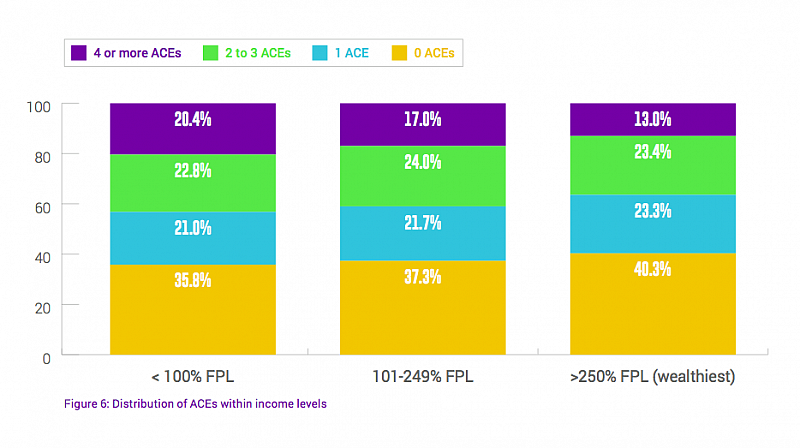
What about income and education? Both are inversely correlated with childhood adversity. In California, about 43 percent of those making less than 100 percent of the federal poverty level had two, three of four ACEs. Compare that with just over 36 percent for those making more than 250 percent of the poverty limit. Similarly, having a bachelor’s or higher degree significantly lowers the chances a person will have had four or more episodes of childhood adversity.
Reviewing the data on childhood adversity and long-term health can leave you with the fatalistic sense that such experiences determine one’s health destiny. But that’s not necessarily the case. “ACEs do not have to determine a person’s life trajectory,” last week’s report states. “Early identification helps stem the impacts of ACEs and toxic stress on a person’s brain and body.
That may well be true, but as I’ve written previously, doctors and researchers still have a long way to go to fully understand what works best to unwind toxic stress and the biological effects of trauma and adversity. The field has gained momentum in recent years, but the breakthroughs aren’t coming fast enough for some.
[Graphics via the Center for Youth Wellness]