
Essential new data tool forecasts hospital capacity during COVID-19 pandemic

Like tornadoes, hurricanes, and other swift moving natural disasters, early warning systems for the spread and impact of the COVID-19 pandemic can be crucial for saving lives.
Unlike natural disasters, though, systems now at least have days if not weeks to plan and prepare. Some health systems have been preparing for years. Others are catching up right now. All of them have a new tool at their disposal, developed by the place where I work, the University of Washington. The university’s Institute for Health Metrics and Evaluation (IHME) created this tool for health systems to prepare for and respond to the surge in cases related to COVID-19.
You can use this tool in your reporting to ask tough questions about what the health care system in your state is doing to prepare. I’m going to walk you through it in detail and then answer any questions you have on Twitter (direct message me @wheisel). Note, too, that IHME is updating the tool daily, so some of the information and the features I describe likely will change by the time this is posted. (When IHME does post updates, it also explains what’s different in a post.)
Let’s start at the top.
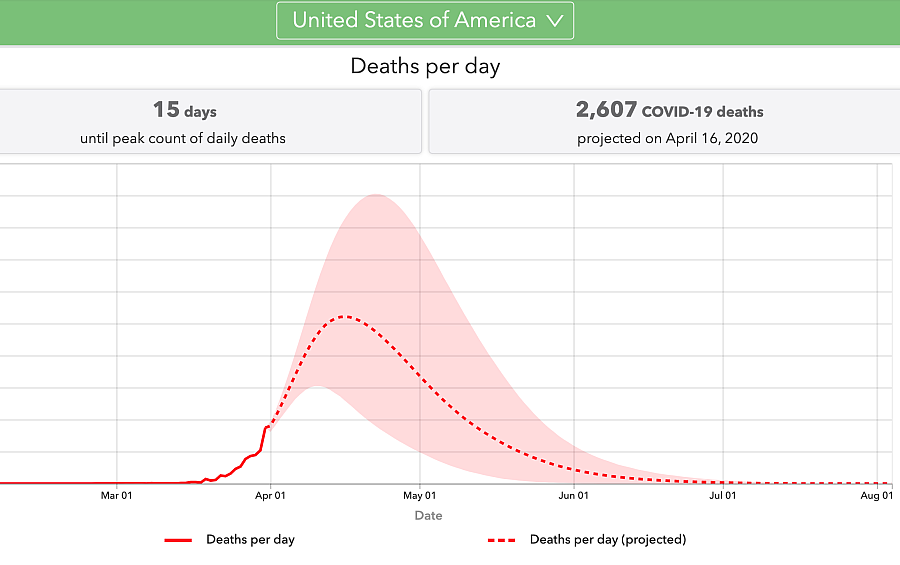
IHME is tracking all COVID-19 deaths and using those deaths as an anchor to then make projections about hospital resource use. What you see on the tool’s landing page are projections of hospital resource use based on COVID-19 deaths. All the projections have one key assumption: “The continuation of strong social distancing measures and other protective measures.”
If you want to see details about how the projections were calculated, you can read about the methods.
Now there’s a dropdown menu. You can pick the United States as a whole (the default) or pick a state. IHME is adding more local information as it gathers the right data and necessary funding to do the work.
Let’s walk through a state to see how you can use this information for your own state to prompt questions about your health system’s preparation plans.
I chose Michigan.
At the top, you will see a breakdown of the different social distancing rules in place in that state, all of which public health experts are finding contribute to the slowing of the spread of the disease and the lowering of the death rate. The state closed its educational facilities and all non-essential services on March 15. It then instituted a stay at home order on March 22. It does not have severe travel restrictions currently in place.
With those measures factored into the modeling, IHME estimates that Michigan will surpass its hospital resource needs on April 10. It is showing that around that date, there will be a total of 14,561 beds needed to handle both current and expected new needs related to COVID-19. That will mean the state will be 4,407 beds short. The situation is worse when it comes to ICU beds. There are 742 beds available in the state, and so the state is expected to be 2,248 beds short at that time. The state also will need 1,798 ventilators, which are generally in short supply across the country.
The first chart shows all of that information in one timeline. You can see the dotted purple line curve up from present day and peak on April 10. The shaded area around the line is the range of possibilities, or, as they say in statistics, the uncertainty bounds. Note that these trends and the uncertainty bounds assume that social distancing policies will remain in place. The solid purple line that runs through the entire chart is the total number of hospital beds in the state. There’s a solid green line, too, for ICU beds.
The next chart tracks the total number of deaths per day. This is the number that can be the most frightening for your audience, and it’s good to take care in how you explain this in the context of social distancing. What IHME is seeing is that death counts will continue to climb over the next week or so, reaching a peak on April 11 of 164 deaths per day.
I showed this chart to some friends during a virtual birthday party the other day (that’s how much COVID-19 has taken over, right?), and my friends told me later that there was some comfort in seeing that if we continue to follow social distancing protocols, we can actually drive those daily death counts down. If you scroll across the chart, you will see that by May 5, Michigan is expected to have one death per day.
The last chart projects the massive rise in total deaths in Michigan. It is stunning to think that Michigan had not recorded a single death in the state just a two weeks ago. It recorded three occurring on March 19. It is projected to reach 3,007 COVID-19 deaths by the first week in May.
All of these charts raise tough questions that you should be asking.
- Were social distancing measures put in place swiftly enough?
- Has the communication of those measures been clear and effective?
- Are organizations and companies adhering to them?
Were there any measures taken to improve bed, ICU, or ventilator capacity following previous outbreaks, such as the H1N1 bird flu epidemic in 2009?
As IHME recently posted in a tweet: “Our estimate of 81,000 thousand deaths in the U.S. over the next four months is an alarming number, but this number could be substantially higher if demand for health system resources is not addressed and social distancing policies are not vigorously implemented and enforced across states.”
Remember: we can’t rely on magical thinking to get through this pandemic. We need to think clearly, plan for a bad scenario, and hope for a better scenario.