
From fires to pollution, California’s struggle to provide clean water deepens

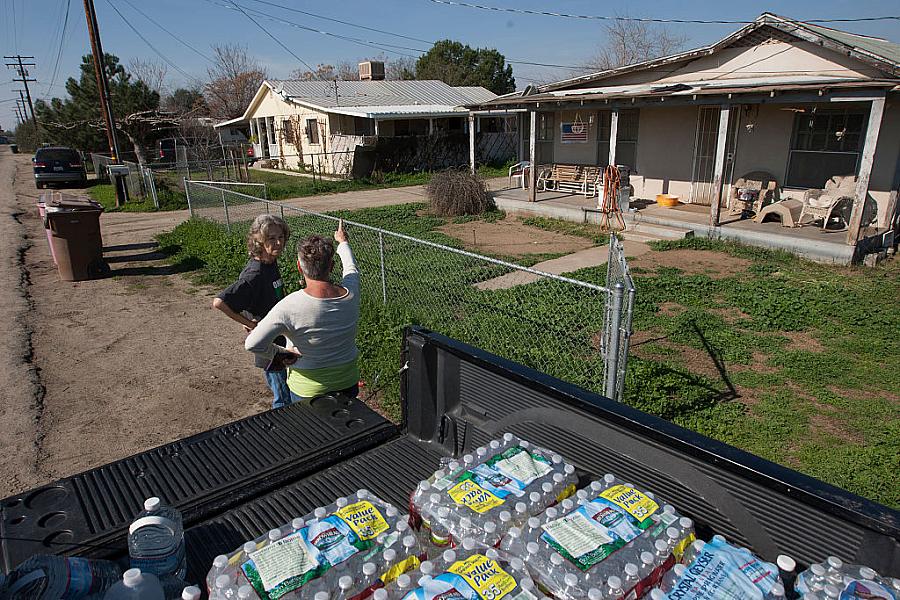
(Photo by David McNew/Getty Images)
In the early days of my reporting on the challenges facing California water districts, my editors and I at Bay City News were interested in understanding the potential impacts on drinking water systems from what appeared to be large numbers of Bay Area residents moving into the San Joaquin Valley.
We surmised that the smaller, rural and semi-rural water systems could be struggling to cope with population growth, development pressures and the corresponding demand to deliver ever greater quantities of safe, reliable tap water to new homes and businesses. Having spent some years reporting on the state’s fractious, balkanized water delivery systems as a young reporter in Fresno, I had some understanding of the challenges these systems were already facing year in and year out.
For generations, the region’s water quality has been plagued by pollutants, both naturally occurring contaminants and those left behind by agricultural and industrial operations. The process to identify and remove these contaminants is often time consuming, expensive and technically challenging, and these burdens fall most heavily on smaller water districts that lack the money or technical expertise to successfully take on major water quality improvement projects. As a result, hundreds of California drinking water systems — that together serve roughly 1 million residents — fail to consistently deliver clean drinking water to ratepayers, according to the California Water Resources Control Board.
At the start, we assumed these struggling water districts would fall further behind when faced with new population growth. But I quickly learned that, somewhat counterintuitively, quite the opposite is true. It turns out that water districts can often leverage development dollars for infrastructure improvements and, once new folks move into a jurisdiction, the water system benefits from an expanded rate-payer population. And while money doesn’t solve everything, it’s it is certainly a key part of the formula for delivering safe drinking water.
This revelation led to a change of focus for my reporting. At about the same time, we learned that the Water Board was nearing the end of a year-long process to develop a spending plan for a newly created $1.3 billion fund meant to rescue roughly 300 failing and at-risk public drinking water systems over the next 10 years. The legislation that created this fund also requires the Water Board to do something never before attempted in California: develop a comprehensive needs assessment that identifies every failing and at-risk drinking water system in the state and quantify what it would take to save them.
Unfortunately, just as the Water Board was developing a policy to guide implementation of the fund, the COVID-19 pandemic arrived. The stay-at-home orders and social distancing mandates that quickly followed delayed some work on the fund. It also led to Gov. Gavin Newsom’s order prohibiting utility shut-offs for people who lost jobs and income due to the pandemic. At the time, there was public speculation by Water Board members and agency staff that the fund could be used to shore up revenue streams for districts struggling with large-scale bill delinquencies.
Our initial reporting highlighted the Water Board’s work to develop the fund and the needs assessment. For our next story, we focused on a pair of public water systems in the San Joaquin Valley that have struggled for years with elevated levels of contaminants and that have racked up dozens of state drinking water violations. These systems epitomize the region’s water struggles in several ways and through them we were able to highlight the difficult realities facing the state’s complicated relationship with drinking water deliveries.
We also leveraged a data visualization tool from Microsoft called Power BI to help us sort through thousands of drinking water violation data sets compiled by the Water Board. By creating an interactive chart that links individual water systems to their violations, contaminant type and county, we were able to find the perfect systems on which to focus our attention. We also published the visualization along with our initial story.
As we were reporting on our final story, outside events again led to a change of focus. This time, it was the devastating megafires that blanketed the Bay Area in smoke in 2020. Regulatory officials and water system managers were telling us that the damage these fires did to drinking water infrastructure was historically severe and significantly underreported. Across the state some 250 water systems were either damaged by fire or endured public safety power shutoffs as a result of fire conditions, according to water officials.
As Stefan Cajina, who leads the Drinking Water Division for the State Water Resources Control Board’s North Coast Section, said of wildfire recovery: "The aftermath is a story that's just beginning to be told."
Greg Pierce, whose team at UCLA’s Luskin Center for Innovation led the effort to create the Water Board’s needs assessment, said in his view stories like ours help humanize the state’s drinking water challenges.
“Stories about particular towns and individuals struggles as told in pieces like this help the public (and regulators and politicians) to be motivated to action in a way that data presented by regulators and academics can't,” Pierce said.
But the project also presented us with myriad professional challenges. The story we thought was there turned into something else entirely. The pandemic dropped one obstacle after another in our way. My deeply talented mentor left for a new job halfway through the project. But nearly every twist and turn also provided us with new reporting opportunities and every pivot led to a greater understanding of the state’s complex water woes.
Our anchor in this sometimes-confounding process was the data itself, which is a trove of untold stories. By first using the Water Board’s Human Right to Water tool and then by working the raw data through visualization software ourselves we were able to better understand regional drinking water trends. This led us first to identify individual water systems whose stories could help highlight those trends, then to sources who could help explain and give context to those stories.
Through it all we re-learned a valuable journalistic lesson: resilience, teamwork and flexibility are a successful investigation’s co-conspirators.