The city sent me 80,000 pages of housing citations. Here’s how I found the stories lurking within

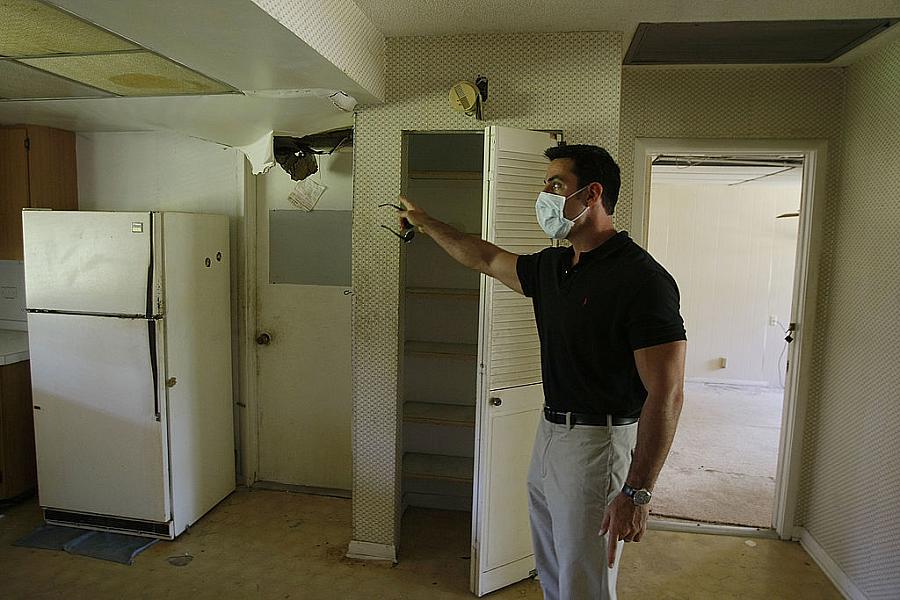
(Photo by Joe Raedle/Getty Images)
We know a lot about renters in Los Angeles. They make up the majority of Angelenos (less than 40% of L.A. households are owner-occupied). They are often severely burdened by the city’s high cost of housing, with nearly half paying more than 50% of their income on rent and utilities alone. They live in some of the most severely overcrowded housing in the country, which exacerbated the spread of COVID-19 in low-income communities of color. And almost three-quarters of L.A. apartment dwellers live in rent-controlled units.
However, we know much less about renters who live in the city’s vast, unregulated web of illegal housing.
These Angelenos — priced out of the legitimate housing market and often living one step away from homelessness — reside in garages converted without permits, illegally subdivided apartment buildings and haphazardly retrofitted commercial spaces. They’re often subject to substandard living conditions and hazardous structures. And they have little recourse in disputes with their landlords, because local governments routinely fail to regulate these housing units and rarely sue property owners to deter illegal rental activity.
This is the world I was hoping to uncover when I first submitted a public records request to the city’s housing department back in early 2020, asking for the city’s inspection records and citations for unapproved dwelling units going back to 2015. I knew that city housing inspectors regularly uncovered and inspected bootleg apartments, but I saw little published data on how many units they were finding each year, the problems frequently associated with those homes and what the city was doing to crack down on landlords renting out these spaces illegally.
What I got in response to my request was an 80,000-page PDF full of citations. Clearly, local regulators were aware of an expansive universe of illegal housing in the city. But how was I going to make sense of it all? Manually combing through the entire document was out of the question — unless I was ready to spend years reading through it all. I knew there was a story lurking in these documents. But I was stuck.
That’s when my editor encouraged me to apply to USC’s Center for Health Journalism 2020 Data Fellowship. She knew other KPCC reporters had a good experience with the fellowship, and she figured the program might help me make sense of the information I’d received.
I admit I was hesitant at first. What if I couldn’t get the data in a more user-friendly format? Would I be committing myself to a labor intensive reporting project, without a clear end-goal in sight?
It turns out my fears were misplaced. My fellowship advisor, Minneapolis Star Tribune data editor MaryJo Webster, reassured me that the city’s housing department most likely had the data I needed stored in a user-friendly database — not just reams of unsearchable PDFs. I just hadn’t gotten the raw data because I hadn’t specifically asked for it in my original public records request. At least not in the exact right way.
Once I learned the right phrases to put in my request (“comma delimited text file” is like a public records magic spell), I received Excel files containing all the information I needed in order to understand where, when and how often the city was citing unapproved housing units during the pandemic and in the years leading up to it. The amount of data was still massive (so massive that Excel couldn’t open it all in one file). However, a crash course in terminal coding helped me winnow down the data to just the information I needed on unapproved housing, making it all more manageable to work with.
Now I just had to make sense of it all. After looking at the data from multiple angles over the course of a few weeks, I found myself losing the forest for the trees. Again, MaryJo Webster helped me enormously by pointing out the obvious, bold-type headline staring at me in the data: the fact that during the pandemic, the city’s citations of unapproved housing units went into a dramatic freefall. Assuming that all the illegal housing that existed in the city before the pandemic still existed during the pandemic, there was only one likely explanation. And that was a reduction in inspections from city housing inspectors during the pandemic.
Sure enough, when I asked the city about the decline in citations, they confirmed that the housing department had cut back on in-person inspections due to concerns over the spread of COVID-19. That answer made sense from a public health standpoint. But when I talked to tenants living in these unpermitted units, they felt trapped in substandard housing during the pandemic, and they were frustrated by the city’s lack of action to help them. Suddenly, I had my story. The data confirmed and gave crucial context to what tenants in this housing had been telling me about their experience during the pandemic, and I could use that data to help our readers and listeners understand what life was like for renters in this shadowy world.
Participating in this fellowship taught me so many data analysis skills, including many approaches to using Excel and Tableau that I still rely on today. But one of the biggest lessons I took away was how to get usable data in the first place. My advice to anyone just getting started on a data project would be to not get intimidated by massive public records dumps, and trust that there’s a better way to get what you need. Even when you’re dealing with records on a largely unexamined problem.

