Herd Immunity: Hospital infections drop after rates go online

Image courtesy of the California Department of Public Health
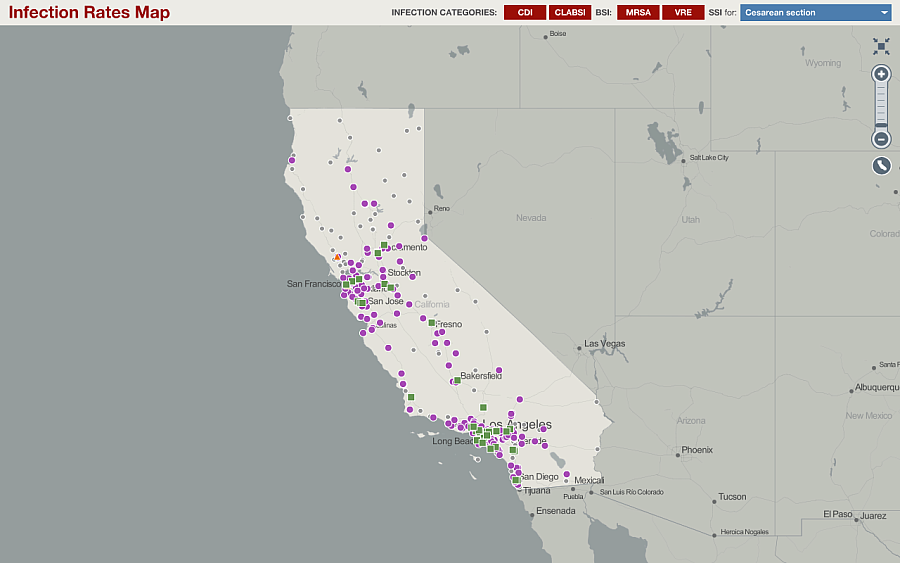
Can a map help reduce hospital-based infections?
Some computer programmers seem to think so. Corey Egel at the California Department of Public Health told me that the agency’s My Hospital 411 map was popular with software engineers who “are very interested in the tool's ability to help prevent HAIs.”
The online map tracks infections after they occur, and it doesn’t provide real time information. Instead, it captures reports from hospitals months later. What then is the mechanism that translates mapping into cleaner, safer health care?
It would require a more detailed and scientific evaluation -- beyond the scope of this blog -- to prove that mapping can actually reduce infection rates. For now, here are two ways infection data mapping could make infections scarcer.
First, infection data and data maps provide the peer pressure necessary to get hospitals to report infections. In many states, California included, the hospital lobby is nearly if not as powerful as the physician lobby. Forcing hospitals to do things they don’t want to do can be tough. That’s why each state has a hodgepodge of reporting requirements for infections and some states don’t report at all. If you can show on a map which hospitals are providing information and which are withholding, the withholders start to look silly. California has seen this happen since it started its map, and now has nearly 100 percent reporting compliance.
So, why does it matter if hospitals report their infection information? That leads to my second point: publicly reported infection data -- and maps like the one California created -- provide the peer pressure necessary to get hospitals to start fixing their infection problems.
See Also: California Makes Infection Mapping Look Easy
In July 2012, Nick Daneman at the Institute for Clinical Evaluative Sciences at the University of Toronto, published a paper in PLOS Medicine with colleagues that showed what can happen when infection data are reported. They examined data for all patients older than one year who had been admitted to an acute care hospital in Ontario at any time from April 1, 2002, to March 31, 2010. They then examined the monthly rate of Clostridium difficile infections compared to overall patient days, which is essentially the number of individual patients admitted to the hospital multiplied by the amount of time they spent in the hospital.
Daneman and his colleagues found that before the hospitals in Ontario had to publicly report their infection dates, the rates of C. difficile were substantially higher. In 2002, the rates of C. difficile infections were about 7 cases per 10,000 patient days. That rate climbed –- as it did in hospitals throughout Canada and the U.S. –- during the early 2000s. It reached 10.79 cases for every 10,000 patient days in 2007.
But then hospitals were required to publicly report their infection rates. In September 2008, the Ontario Ministry of Health and Long-Term Care started gathering monthly data on hospital-acquired C. difficile infections from all hospitals in the province. Crucially, those data were not simply stored on a computer. They were put on a website. The website lets people look up individual hospitals and see how they compare on:
- Clostridium difficile Infection (CDI)
- Methicillin Resistant Staphylococcus aureus (MSRA) Bacteremia
- Vancomycin Resistant Enterococcus (VRE) Bacteremia
- Central Line-Associated Primary Bloodstream Infection (CLI)
- Ventilator-Associated Pneumonia (VAP)
- Surgical Site Infection (SSI) Prevention
- Hand Hygiene Compliance (HHC)
- Surgical Safety Checklist Compliance (SSCC)
- Hospital Standardized Mortality Ratio (HSMR)
In less than a minute, I was able to find out that Toronto’s Hospital for Sick Children had a lower rate of C. difficile than every other acute care teaching hospital in the city and that it appeared to be improving over time. Interestingly, the hospital affiliated with the Daneman’s institution, Sunnybrook Health Sciences Center, had a C. difficile rate that was more than four times the rate at the children’s hospital and was second highest in the city.
That type of comparison can be a powerful driver for institutional behavior. Daneman and colleagues found that public reporting was associated with a significant drop in infection rates. In the post-reporting period, researchers found that cases fell to 8.92 per 10,000 patient days. Given the trend line, researchers had predicted that the hospitals would have had a rate of 12.16 infections for every 10,000 patient days. They wrote:
Finally, the researchers estimate that public reporting was associated with a 26.6% reduction in C. difficile disease cases and that it averted about 1,900 cases per year.
That’s a lot of suffering and expense eliminated by a URL.
Have your own ideas on how reporting infection data could lead to better health outcomes? Let me know at askantidote [at] gmail.com or via Twitter @wheisel.
Related Links:
California tries to cure prescription drug tracking system

