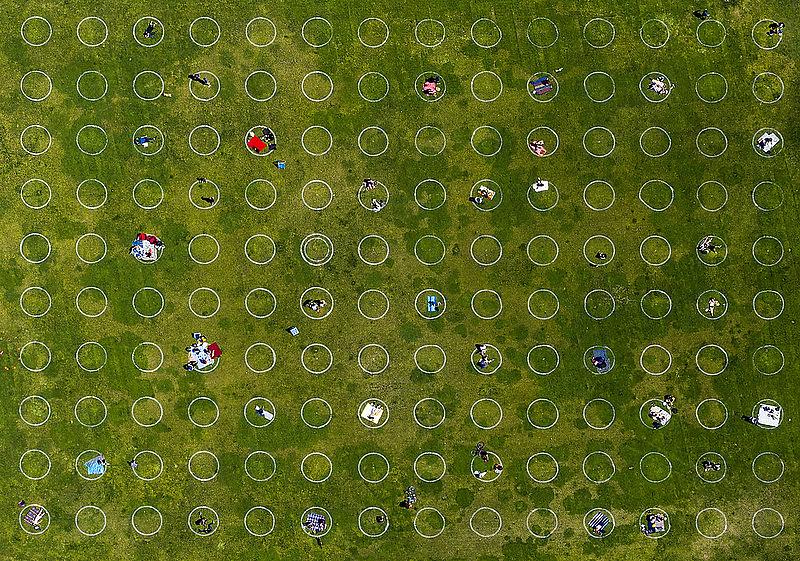
San Francisco touted itself as a model city on COVID-19, overlooking a stark disparity

(Photo by Christopher Michel via Flickr/Creative Commons)
There was a certain phrase trumpeted by San Franciscans in the pandemic. “We did it,” the public health director, some epidemiologists, and the mayor would say. San Francisco had handled COVID-19 the best compared to any other metropolitan city in the United States of America — look at our marvelously low case rates and deaths.
Cue the headlines and national adoration.
Yet we knew that behind the feel-good stories that led health officials to pat themselves on the back, there was a but. A big one at that.
If you took a closer look at any of the underserved neighborhoods of San Francisco, you’d know that the southeast sector of the city — including the Mission District, where we worked — was getting battered with new cases, a sign of rapid transmission.
If you analyzed the cases by race, the inequities were even more apparent. The Latino population, despite comprising only 15% of San Francisco’s population, made up almost half of the total COVID-19 cases.
By the time December and January rolled around, though, that fact was old news. People, except for the community organizations working closing with these populations, didn’t want to focus on the negative. Nevertheless, the winter surge arrived, repeating the earlier brutal pattern for the Latino, Black and southeast sector yet again.
Seeing the effect in our own backyard, we felt obliged to remind San Francisco that despite the accolades, the impacts of COVID-19 were very much real in our city.
It was days until the New Year, and we were the only ones in the office. A local paper just ran another glowing review of San Francisco’s performance during the pandemic, as community organizers next door prepared for a spike of cases in the upcoming holiday. We felt frustrated.
So, fresh from our USC Annenberg Center for Health Data Fellowship, we set to work.
“I want to look at the data of other metropolitan cities, and let’s look at the race cases rates,” Chávez said. “Oh, and let’s hammer it out in two days.”
Despite being extremely new (Hom) or rusty (Chávez) at using Excel spreadsheets in a meaningful way, we set off. We picked off a handful of cities that the local paper had compared San Francisco to, and then scoured the internet for COVID-19 data that we could download. We chose datasets from metropolitan county departments to make it comparable, since San Francisco is an odd city-county entity.
We’d rounded up numbers from counties encompassing Houston, Texas; San Antonio, Texas; Dallas, Texas; Philadelphia, Pennsylvania; San Jose, California; Maricopa County, Arizona; and Indianapolis, Indiana, among others. In the end, we had about 20 counties. A few of them, including Maricopa County in Arizona, and Duval County in Florida, were nixed after we’d realized they didn’t break down their COVID-19 data by race.
Then, we created a master spreadsheet. This was no easy task. Many of the counties didn’t yet post cumulative case rates, and often only posted the total number of cases each ethnicity had had. Luckily, we knew that case rates were calculated simply: total number of cases divided by that ethnicity’s population, multiplied by either 10,000 or 100,000 people. (We standardized it to 100,000 people, since that’s what San Francisco used.)
We crunched numbers using the case rate formula and our handy new Excel skills, and then re-ordered the counties based on their highest ethnic case rates.
This led us to a bombshell finding. San Francisco, even with a lower Latino population than some other counties, had the second-worst Latino case rates compared to the other metropolitan areas — even those it had beat when it came to overall case rates.
Yet we worried that finding alone wouldn’t underscore the lopsided effects of the virus to our audience. So, we created a different equation with a data scientist who’d worked regularly with COVID-19 numbers, and vetted it with an epidemiologist as well. We were able to demonstrate the likelihood of a member of a given race contracting COVID-19 compared to other races.
This disparity was stark, and became the caption to most social media posts other reporters circulated shortly after we published: Latino residents are five times more likely to get COVID-19 in San Francisco compared to any other race.
White San Franciscans, however, are two times less likely to get COVID-19.
Yet race only plays a factor in areas where preexisting racial inequities cut deep in certain ways. In San Francisco, Latino were getting sicker not because the virus targeted them, but because they were more likely to live in overcrowded housing and have limited options to self-isolate, and because they were more likely to work in essential worker jobs that risked exposure.
We attempted to further contextualize our findings by referencing the social vulnerability index from the Centers for Disease Control and Prevention. This offers a measure of the systemic factors contributing to poverty, such as socioeconomic income, race, and living situation. This underscored what many epidemiologists and experts have emphasized throughout the pandemic: prior inequities drove up the risk of who was getting the virus.
Ultimately, these stories captured the attention of thousands of readers and were used by community groups who were testing and vaccinating underserved communities. They pointed these articles as evidence to why they should receive more funding and continue their efforts. Other stories we produced illuminated how resources were being distributed in the Mission, and the complications involved in testing and vaccinating underserved groups in neighboring Alameda County.
Our stories helped cut through the noise and center on what really mattered — the people who were affected the most by the pandemic.


