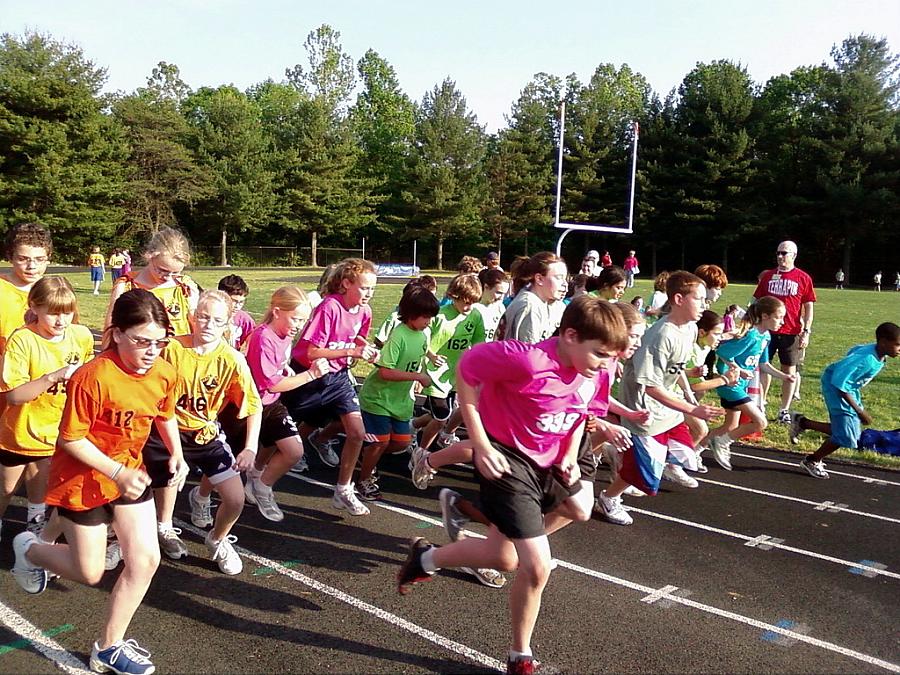
Vast Disparities in Kids' Fitness

Only 31 percent of public school students in California who took the 2011 statewide Physical Fitness Test received healthy scores on all six different measurements of fitness the test scores. Sounds pretty bad, doesn't it?
But that number obscures huge differences in how students at different schools -- and of different social classes -- perform on the test. I analyzed the scores for Bay Area fifth graders and found enormous disparities in students' scores. The schools with the fittest fifth graders had few -- if any -- students eligible for the free or reduced school lunch program. In other words, wealth translated into health. In my piece, I exploded why by showing the contrast between the elementary school in the Bay Area with the highest scores and one with some of the worst scores.
Here's the piece, which ran both in The Bay Citizen and in the Bay Area pages of The New York Times.
The biggest reporting challenge in getting this story was securing access to portray the school where students had done very poorly on the test. Unsurprisingly, I had no trouble with access at the school where students had excelled! I ultimately got the interviews I needed to do the piece, after some friendly badgering.
The story has garnered a lot of interesting comments on The Bay Citizen Web site with readers reflecting on the socioeconomic disparities at the root of the students' scores.

