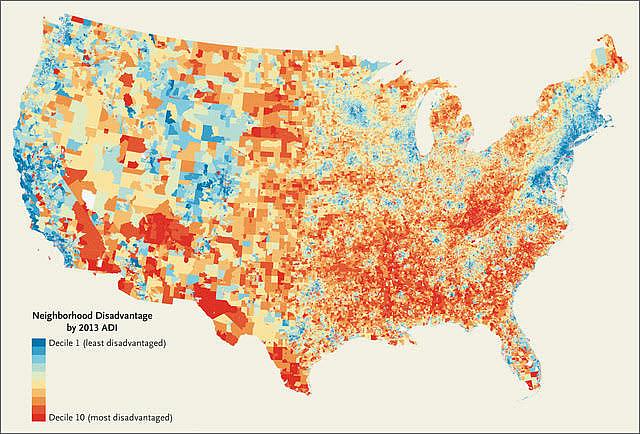
This vital new health atlas offers fresh look at how place shapes health

Image: New England Journal of Medicine
For years, Dr. Amy Kind has been keenly aware that the neighborhoods in which her patients live often hinder their recovery. She described, for example, how worries over neighborhood safety deter home health care staff from visiting some of her low-income patients to check on their recovery. In one case, that lack of follow-up care meant a 78-year-old patient with mild dementia forgot to take his antibiotics to treat his pneumonia, and was readmitted three days after leaving the hospital.
Kind, an associate professor at the University of Wisconsin School of Medicine and Public Health, also described the futility of, say, diabetes education for patients who live in substandard housing that lacks adequate refrigeration in which to store insulin. Or how some people are too embarrassed to tell their doctors that they often can’t afford to heat their homes, or don’t have reliable electricity. “Those are hard conversations to have,” Kind said. Those are among the many social factors, she said, that profoundly influence health but which typically lie outside standard medical care.
She knew there were ways to map levels of neighborhood distress or affluence to shed light on the environments in which her patients lived, but it takes a team with technical expertise to create them.
So Kind began to dream big, envisioning a map that would portray the degree of neighborhood distress — or comfort — for virtually every address in the nation. That information, she said, would help physicians ask more targeted questions, support more research into health disparities, and help make a case for more resources in distressed areas. “The hope was to change the conversation,” Kind said. “It was to give another tool to look at health and equity through a new lens.”
So she sought grants to create such a tool, and after years of work, her team debuted the “Neighborhood Atlas” last month in the New England Journal of Medicine. The tool lets users type in any address in the United States and Puerto Rico and then see how that neighborhood compares with others throughout its state, as well as its national ranking. The National Institute on Minority Health and Health Disparities and the National Institute on Aging funded the project.

The Neighborhood Atlas draws much of its data from the “Area Deprivation Index,” or ADI, a metric that ranks neighborhoods by 17 socioeconomic indicators culled from census data, such as education, employment, and income levels, housing costs and density, and more nuanced data like access to plumbing, transportation and telephones.
But the ADI data typically portrayed disadvantages only down to the county level, which limited its practical use. So Kind teamed with colleagues, including health geographer William Buckingham, for the laborious process of linking the more than 69 million nine-digit ZIP codes to the ADI data to provide an unprecedented level of insight into neighborhood conditions nationwide.
Type in any address and the atlas shows its ranking on a statewide level, from 1 to 10, and on a national level from 1 to 100, with largest numbers showing the areas of greatest distress. For example, I once reported on a 16-year life expectancy gap between two ZIP codes in the San Francisco Bay Area. On the Neighborhood Atlas, the high life expectancy neighborhood in Walnut Creek ranks in the top 20 percent of neighborhood advantage statewide. In contrast, the West Oakland neighborhood, where life expectancy is 16 years lower, ranks in the bottom one-third of neighborhood advantage statewide. So in addition to describing the contrasts between the two neighborhoods, had this been available at the time, I could have added quantifiable data showing how conditions differ.
One can also view an entire state or the nation on a “heat map,” which shows a gradient from dark red — the deepest disadvantage — to dark blue — areas of greatest advantage — and shades in between. You can also select only those regions corresponding to the shade of red or blue selected. Or zoom in closer to see street names, parks and other landmarks. The data is easily downloaded, including the maps, and is freely available to the public. The University of Wisconsin says several state and federal agencies are already using the atlas, including the Centers for Medicare and Medicaid to refine a diabetes management program.
“The hope is to give ground workers, like myself and others, additional tools to allow them to be more effective,” Kind said. “I’m also hopeful that we can catalyze real policy change to tackle some of the very challenging issues surrounding social determinants of health. I would argue that we should pay just as much attention to the social determinants as we do to the drugs that we prescribe.”
For journalists, the data provides a new tool to compare local conditions to those statewide or nationally, based on widely accepted U.S. Health and Human Services data. The atlas yields a metric showing the combined influence of education, employment, housing quality and income on neighborhood ranking — which are among the most powerful social determinants of health. It doesn’t include disease rates or life expectancy data by ZIP code, although those are increasingly available from local and state health departments.
For Kind, the atlas also struck a personal chord. She learned that the rural neighborhood in northern Wisconsin in which she grew up classified as among the most disadvantaged in the United States.
“Our health disparities are in many ways worsening in our country,” Kind said. “For the amount of wealth in the United States, it really is terribly, terribly sad that we do not have health outcomes that reflect that wealth. So how can we think of new ways to improve the health of all of our population, not just a subset?”
Suzanne Bohan, a veteran reporter and former Center for Health Journalism Fellow, is the author of the book “20 Years of Life: Why the Poor Die Earlier and How to Challenge Inequity” (Island Press).

