
How data reporting can help you find new angles on oft-told tales

How do you find a new angle on a problem that’s been investigated scores of times before with little progress toward solutions?
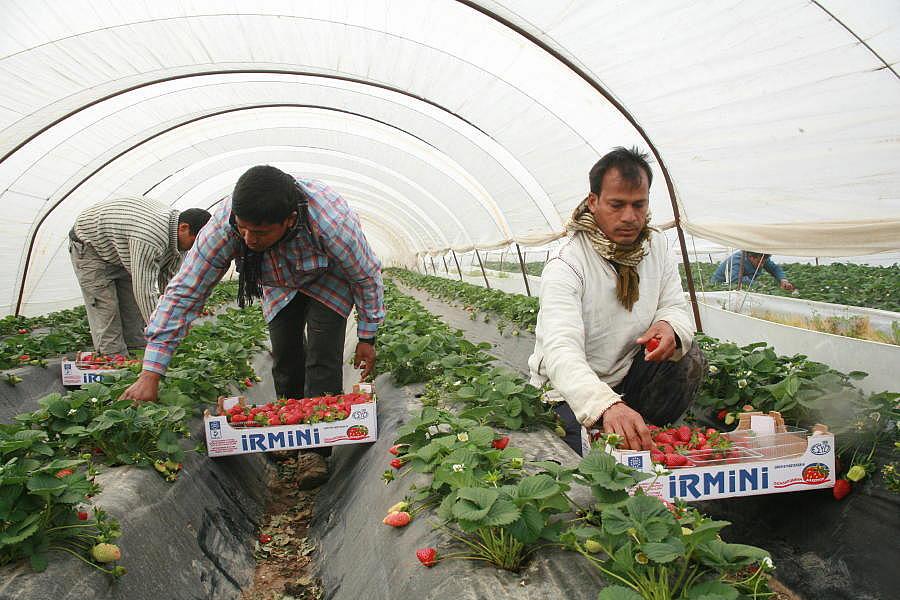
I first pondered this question four years ago, when I was working on a story about environmental risks threatening California farm-working communities. It’s no secret that these communities often face a plethora of hazards compounded by substandard living conditions. The issue has been covered in countless stories, books and even movies. But robust data showing the nature and extent of the problem seemed to be lacking.
I found the data I was looking for in the research of Carolina Balazs, who had revealed social disparities in nitrate-contaminated drinking water in small towns in California’s San Joaquin Valley. For decades, nitrates and pesticides had been contaminating groundwater drinking supplies and Balazs showed that it was mostly Latinos who were affected. And, as a high-profile report showed, California officials knew for nearly as long that the state’s agricultural industry, worth $37.5 billion at the time, was responsible. Yet regulators didn’t force growers to change their practices or help the people living in these communities get access to safe, affordable drinking water.
So residents of these small towns, which lacked a large enough customer base to pay for effective water treatment, found themselves paying for water they couldn’t drink and then, to fill the gap, buying bottled water they couldn’t afford.
Visiting the towns and meeting some of the people living there, I was struck by how so many had learned to adapt to a situation that was neither safe nor fair. Many residents were equally resigned to the presence of pesticides in nearly every sector of their lives – at work, around their homes and even next to their children’s schools. Making matters worse, many people had little formal education, didn’t speak much English and experienced other social inequities that increased the likelihood that the hazards in their midst would harm their health.
Americans are intimately connected to the people who live in these towns – California supplies nearly half the nation’s fruits, nuts and vegetables. And though they may be aware that farmhands work under tough conditions, most have little concept of the environmental and health risks that define their daily lives.
For my Dennis A. Hunt Fund project, which was produced by the Food & Environment Reporting Network and ran in The Nation, I wanted to convey the risky conditions that farming communities routinely endure in a way that readers couldn’t ignore. To do that, I needed the same type of rigorous analyses that supported my previous story.
There was just one problem: the type of studies I was looking for didn’t exist. I would have to gather and analyze the data myself.
At first, I thought I could investigate the cumulative challenges facing farming communities, to show readers the full scope of the environmental health risks facing the people who harvest our food.
To get a sense of where the most impacted communities might be, I approached Jonathan London, director of the UC Davis Center for Regional Change. London is doing innovative “participatory research” by working side by side with local residents to document and ameliorate the cumulative impacts of environmental and social problems in underserved communities. He pointed me to several towns, including Huron, a small Central Valley town boxed in by agricultural fields about 40 miles southwest of Fresno, which ranked third as the city most contaminated by year-round particle pollution in the U.S. in 2013.
I made a few field trips to Huron to interview residents and heard many stories about what it’s like to grow up surrounded by vast tracts of intensively farmed land. Siboney Cruz, a Huron native who had recently left in search of cleaner air, was 8 years old when she first gathered in the street with her friends to watch the crop dusters pass overhead. Often, the trailing mist settled in her hair as she watched the planes land on the airstrip a few hundred feet from her house. When she was older, she realized that her childhood habit might have placed her at risk. But Cruz, like many other people I spoke with, felt powerless to do anything about it. “People don’t like the spraying near their homes,” she said. “But what can they do?”
At a community meeting, I heard about poisoning incidents and health concerns, including fears that pesticides were responsible for the cancers, stomach problems and respiratory problems that seemed to plague the town. People also worried that pesticides could be to blame for their kids’ learning difficulties, which seemed particularly prevalent at the Huron Elementary School, a woman told me. And though it was true that Huron’s elementary and middle schools (the town has no high school) ranked consistently among the worst-performing schools in the state, factors such as poverty, language barriers and teaching proficiency could also play a role.
When I came back home, I started gathering data on environmental hazards in Huron and other communities, using the Office of Environmental Health Hazard Assessment’s environmental health screening tool, CalEnviroScreen, EPA’s Enforcement and Compliance History database, and the agency’s integrated EnviroFACTS tool. I also looked into the incidence of specific ailments associated with ozone, pesticides and other hazards reported through the screening tool, using several health databases, including UCLA’s California Health Interview Survey and the California Department of Public Health’s Environmental Health Tracking Program. And I gathered demographic and social data using several tools, including the Census’ American FactFinder and the Rural Data Portal. (For an invaluable tutorial on using Census data, check out Health Is Everything.)
But I quickly realized the project I had originally envisioned – trying to detect correlations between the hazards present in the community and the incidence of disease – was in fact an epidemiological study, not a reporting project. And even though epidemiologists and other health experts had agreed to guide me through the process, I also ran into another problem: most of the towns had fewer than 5,000 residents, some barely had 500. They were too small to guarantee patient confidentiality, which meant I couldn’t access the data. Such information is available to researchers under strict restrictions overseen by their Institutional Review Boards, but not to reporters. Several of my data requests to the health department ran into the same problem. I needed a different approach.
I went back to the CalEnviroScreen tool and looked at the environmental hazard categories, focusing on those with the most information about known health effects. (You can download the raw data here.) I ruled out ozone and particulate matter because it would be too hard to pin down potential exposures. Pesticides, I decided, would be easier to track. Not only does the state keep a database of pesticide use records for every county in California going back decades, but there was a wealth of old – and, more importantly, emerging – evidence on health effects for several classes of pesticides. Plus, the state had air monitors to detect pesticides classified as toxic air contaminants in several locations as part of the Air Resources Board’s Air Quality Monitoring Program. Data collected by the monitors could signal potential exposures.
CalEnviroScreen was a great place to start but it only provides a two-year average for pesticides by ZIP code. (While I was working on my project, the agency came out with a new version, which analyzed pesticide use at the census tract level.) The California Department of Public Health also has a handy agricultural pesticide mapping tool that gives you a snapshot of the types and amounts of pesticides applied in a given area. The Department of Pesticide Regulation offers a similar tool, the California Pesticide Information Portal. But none of these resources gave me enough data to detect trends over time throughout the state.
I wanted to know how the use of pesticides classified by state officials as among the most hazardous, based on their toxicity and ability to drift off fields, had changed over time. And I wanted to know if application rates had increased in certain communities. For that, I had to download zip files containing pesticide use data for all 58 counties in California by year. I ended up with millions of records that I could filter by the 66 pesticides I’d decided to focus on. But because pesticides are reported in obscure geographic units called MTRS – for meridian, township, range, section – based on the Bureau of Land Management’s Public Land Use Survey System, I needed help mapping the data to the places people live, census ZIP codes.
Again, I approached Jonathan London, who was incredibly generous in offering the help of geographic information specialists on his staff at the Center for Regional Change. I could not have done this project without their help.
With the pesticide data mapped to ZIP codes (pounds of pesticides applied were divided by the area of each ZIP code to standardize the data), I could sort the data to see which communities were most affected and whether use changed over time.
I found that use of many of these 66 chemicals had fallen statewide. But in a small proportion of communities – places already dealing with heavy pesticide use – applications were increasing. Over 29 million pounds of pesticides considered hazardous by California health officials – more than half of the amount used in the entire state – were concentrated in just 5 percent of California’s 1,769 census ZIP codes.
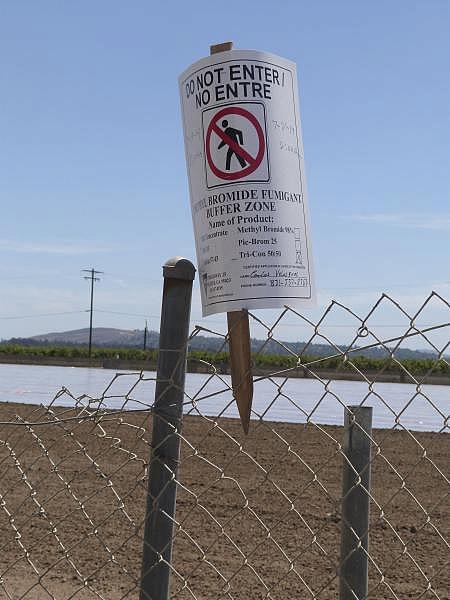
The hardest hit areas were in Oxnard, a place I hadn’t even considered. Oxnard is a strawberry-growing stronghold, which depends on heavy applications of fumigants. And fumigants were driving the area’s increase in pesticide use.
I went back to my census data to match ZIP codes to demographics and a clear picture emerged: the four ZIP codes with the highest pesticide use in the state clustered around Oxnard, where 72.4 percent of the population is Latino.
Oxnard is also home to Rio Mesa High School, which has been at the center of a Title VI Civil Rights Act complaint since 1999. Title VI prohibits recipients of federal funding from discriminating on the basis of race, color or national origin. The US Environmental Protection Agency regularly awards California pesticide regulators millions of dollars in grants. The EPA is obligated to ensure that recipients of its funding comply with the Civil Rights Act. But pesticide regulators violated federal anti-discrimination laws, families in the Title VI complaint argued, by approving permits for toxic chemicals that disproportionately impacted Latino schoolchildren, who attended schools near fields with the highest methyl bromide levels in the state.
That gave me an entirely different story.
I spoke with Brent Newell, an attorney at the Center on Race, Poverty and the Environment who represents the families, and learned that the EPA had ignored the complaint for over a decade. Even worse, when the agency finally made a preliminary decision – ruling that pesticide regulators had violated Title VI by approving methyl bromide permits that disproportionately affected Latino schoolchildren – it didn’t involve, or even inform, the families. They didn’t find out until the EPA announced it had “settled” the complaint by entering an agreement with pesticide regulators – an agreement that did nothing to reduce levels of toxic pesticides near the schools.
One of the best parts of using data to report stories is that your findings often force you to rethink your assumptions. If you’re not prepared to change directions when the data challenges your assumptions, data reporting may not be for you.
Many experts I spoke with at the beginning of my project thought I should focus on the Central Valley to uncover environmental disparities, especially in relation to pesticide use. And, of course, that makes sense. Fresno and Kern counties have long ranked number one and two in terms of most pesticides applied in the state. But those numbers include sulfur and other pesticides that are less likely to drift and cause harm than the chemicals I focused on.
The data told me a different story than the one I thought I was reporting. Suddenly, all the reporting I’d already done no longer fit into the story that was emerging. I’d happened upon a community that has been struggling with high pesticide use for years. These people knew they and their children were probably inhaling toxic chemicals all this time, and they knew it was a violation of the Civil Rights Act. And regulators knew it too. But they didn’t do anything about it.
That gave me a powerful frame to work with. To keep me focused on the primary thread of the story, I kept a Post-it affixed to my computer monitor: “Who’s failing?”
The story seems to have struck a chord with readers. It rose to the third most-read stories on The Nation’s website the day it was published and stayed there for three days. Some readers have asked me, how could the EPA have ignored the families’ complaint, and especially their children’s health, for so long? It’s a question that, so far, remains unanswered.
[Top photo by Noborder Network via Flickr. Lower photo by Liza Gross.]
Read Liza Gross's fellowship story: "Fields of Toxic Pesticides Surround the Schools of Ventura County — Are They Poisoning the Students?"