
Shortened Lives: The Backstory

After completing a four-part series on the striking gap in health and life expectancies between rich and poor neighborhoods with my colleague Sandy Kleffman, called "Shortened Lives: Where you live matters," it became clear this was a novel and compelling approach to covering health that had gone under the radar. The series was published in December, 2009 by the Bay Area News Group, a Northern California newspaper chain that includes the Contra Costa Times and the Oakland Tribune.
Two developments in 2008 brought the phenomenon of "social determinants of health" to our attention. One was a pioneering series aired on PBS called "Unnatural Causes," which combined poignant personal stories with expert analysis to show why those lower on the socioeconomic ladder live shorter, sicker lives.
The second was an elegantly-written 2008 report from the Alameda County Public Health Department detailing how factors like education, access to services like grocery stores and convenient transportation, neighborhood conditions and other external factors play a profound role in how long or healthy a life you're likely to live.
These sources provided a startling new lens from which to view health, one far different from the usual emphasis on access to health care, the latest drug or treatment advance, or new understanding of exercise and diet. Amid a growing body of research on the social determinants of health, a growing number of public health agencies, like Alameda County's, make the case that unhealthy neighborhoods play a far greater role in triggering diseases than germs, bad genes or irresponsible behavior, and that more health care dollars should be spent on this root cause of ill health.
We teamed up on Shortened Lives in the fall of 2008, after we both were accepted for a California Endowment Health Journalism fellowship and learned that each of us had pitched stories covering health inequities as our fellowship project. The fellowship that year also focused on covering health inequities, providing us with additional sourcing and ideas.
We proposed a four-day series to tell the story of health disparities in the East Bay, as well as the burgeoning movement in our region to address these health inequities, and our editors supported it.
Our analysis found a stunning 16-year difference in life expectancy in neighborhoods just 12 miles apart. We also looked at rates of heart disease deaths, cancer deaths and child asthma hospitalizations, and a clear pattern emerged: People in the poorest areas consistently lived shorter and sicker lives than others.
Start with the data
We began by contacting leaders of two county health departments in our circulation area to explain what we were doing and get them on board. Many counties now have a unit devoted to addressing health disparities, so that's an ideal starting place for researching the topic, getting local statistics and finding sources.
In our case, leaders of both health departments quickly became enthused about our project. Dr. Anthony Iton, who at the time was the Alameda County public health director, generously agreed to have county epidemiologist Matt Beyers work with us.
Not only did Beyers bring credibility to the series, but his expertise was essential for crunching numbers that provided critical statistics for the series. Using Beyers' data, which included U.S. Census and other data from Alameda County and adjacent Contra Costa County, our graphics department produced color-coded maps. The maps revealed that in some low-income communities, people die of heart disease and cancer at three times the rate of more well-to-do areas.
The analysis showed that middle-class ZIP codes also experience major health inequities: In one blue-collar neighborhood, residents could expect to live eight fewer years than those in a more affluent community a few miles away, although they lived on average eight years longer than those in an impoverished neighborhood nearby. Our online team then developed an interactive version of the mapping. Readers could punch in their ZIP codes and answer the question on everyone's mind: Where does my area rank?
Once we got the ZIP code data on life expectancies and disease rates, we needed to show the people behind the statistics. That began our search for profile subjects, which proved the most challenging part of the project.
Telling the human story
We decided to seek profile subjects in the ZIP codes with the highest (87.4 years), average (79 years) and lowest (71.2 years) life expectancies in our two counties. That sharply limited our pool but would elicit the most compelling stories.
We also sought profile subjects to illustrate the struggle of trying to stay healthy in poor neighborhoods and those near pollution sources like freeways.
To find these subjects, we called all manner of organizations, including public health departments, hospitals, nonprofits and churches with operations in the ZIP code we were targeting to find out if any leaders or members of these groups would participate.
It took many dozens of calls to finally find the right sources. Some people were reluctant to have their lives opened up to newspaper coverage, especially more affluent residents. Repeatedly, a suitable subject in the ZIP code with the highest life expectancy would be found, but he or she would decline to participate, stating an aversion to appearing privileged while others were struggling. We finally contacted a former editor with one of our newspapers who happened to live in this ZIP code, and her husband agreed to be the profile subject for that area.
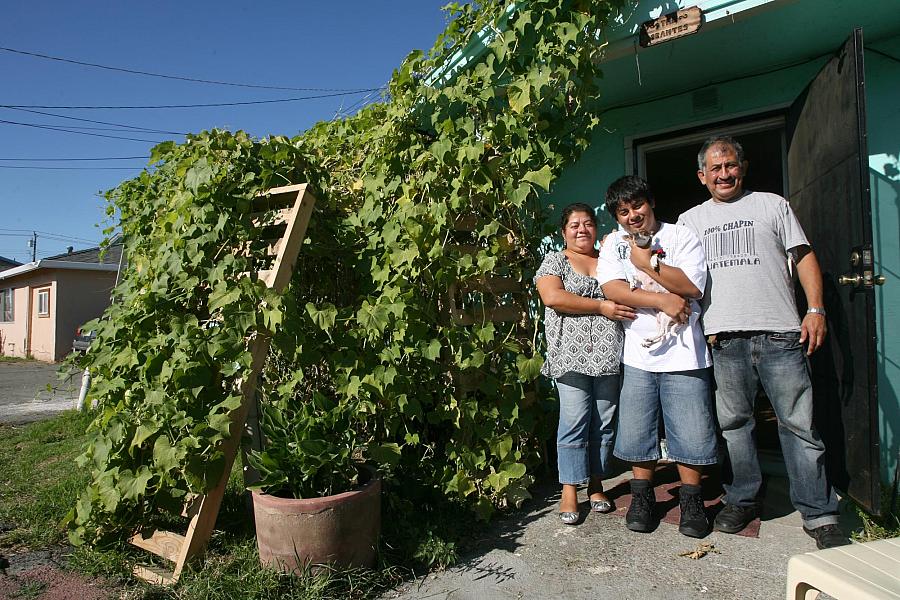
There's no easy shortcut for finding these sources. We found success in the wealthier area by using a direct referral (the former editor), and in the middle-class area through a call to a nonprofit that happened to have a board member living in that area. For the poorer area, spending an afternoon at a cooking competition held by the community's only church led to an ideal family to profile. And there were numerous dead-ends along the way while searching out these subjects. A similar process was followed for finding a youth with asthma to profile, and an adult with heart disease, to provide an intimate portrayal of the struggle to attain health while living in an unhealthy neighborhood.
It's work – no doubt about it. But the results were powerful.
This effort took place over several months, and was interspersed with our usual workloads. In fact, there were sometimes weeks that passed with virtually no work done on the project, although more typically we'd fit in a few hours here and there. Some of the subjects wondered if we'd decided against doing the project, since they hadn't seen it published and it had been months since we'd talked.
We finally sat down with our editors and set deadlines, which were kept. Toward the end, our time was freed up to focus almost solely on bringing in the project, and we assembled a team of about 10 people to work on it, including a project photographer/videographer, a mapping expert, graphic artists, a page designer, online producers and managers, and our editors. We met every three or so weeks during the final months to stay on track. In the end, the promotions department also got involved to develop newspaper rack placards to promote the series.
We found experts to interview through a range of sources, including referrals from Larry Adelman, the executive producer of Unnatural Causes, who was fully supportive of our project, as well as referrals from the public health departments. Various reports on health disparities led to many other sources, as well as Nexis searches on the subject.
Multimedia series, many moving parts
The arc of the series presented an overview of the issue on Day 1, took a more personal look at the phenomenon on Day 2, and then turned the attention on Day 3 to novel solutions under way to reduce health disparities. Day 4 ended the series with a look at how proposed federal policies for the first time would begin to remedy the issue and a discussion of the role of personal responsibility versus social determinants in one's health status.
To get the online audience involved, we ran an online poll on Day 4, and hosted "live chats" online after Day 2 and Day 4. A San Francisco TV station, the ABC affiliate with which we have a partnership, also featured profiles on the series during its run. We also conducted two online chats, one with Dr. Anthony Iton and Larry Adelman and one with former U.S. Surgeon General David Satcher and Rich Hamburg of the Trust for America's Health. We posted the transcripts afterward.
We received many e-mails and calls from around the country as the series ran over two consecutive weekends, as the Sunday and Monday centerpieces. Some expressed their appreciation for taking on an issue they had labored in relative obscurity to tackle. Two public health professors at UC Berkeley have made the series required reading in their courses focused on healthy communities, and one of us appeared on a panel before a large audience of UC Berkeley students. We also won the White House Correspondents Association's Edgar A. Poe award, which honors broadcast and print coverage of national significance.
The online department packaged Shortened Lives as a Special Report, which will remain on our website. In it, we have a place for "Continuing Coverage," since we know this is an issue that we'll now be tracking regularly.