
Digging deeper into a city’s data dashboards uncovers hidden stories in homelessness records

(Photo By Liz Hafalia/The San Francisco Chronicle via Getty Images)
As a reporter who has covered San Francisco for years, I’ve watched as the city has updated its websites with cleaner data tables that were easier to read, tracking everything from demographics in city housing to coronavirus vaccination rates and police arrests.
Officials often tout these public data dashboards as tools to increase transparency and proof that the government is addressing the issues people care about most.
One of those issues is homelessness. A 2022 poll by the San Francisco Chronicle found that 39% of residents reported homelessness as the city’s top problem, and over 70% named it among the top three.
You’d think that the public dashboards featuring homelessness data would be a blessing for me, accelerating my work on this critical topic and the agencies charged with addressing it. The reality is not so simple.
For my 2023 Center for Health Journalism Data Fellowship project, I took a peek under the hood of the Department of Homelessness and Supportive Housing’s data to understand how effective and accessible the city’s services system really is.
The longer I spent rummaging under the hood, the more I realized that for everything the dashboards showed, there was much more that they obscured.
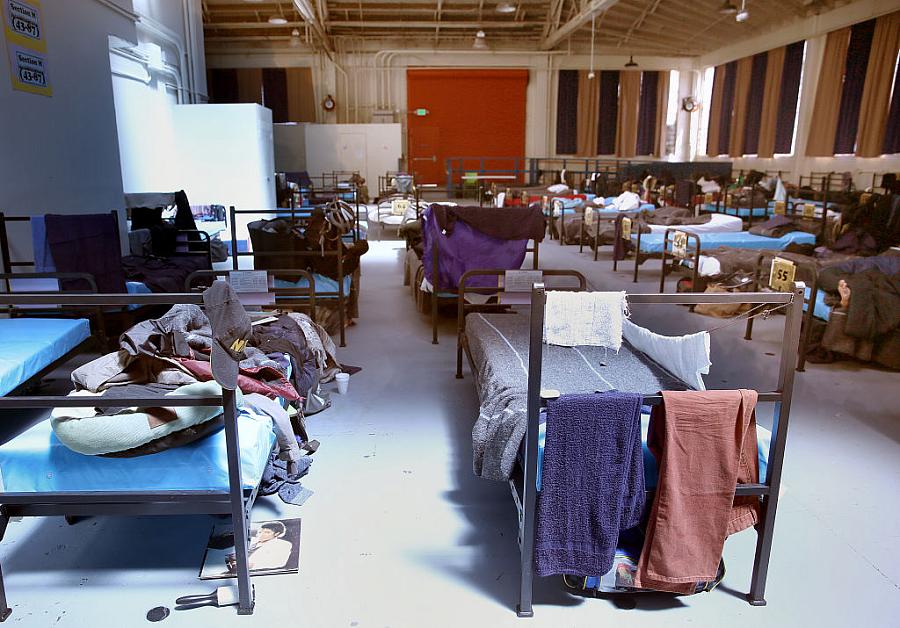
Take, for instance, the shelter occupancy rate. In family shelters, the rate tends to hover around 93%. A layperson might read that as meaning that 7% of shelter beds are vacant and available. I wanted to fact-check that assumption.
First, I wondered: How accessible has shelter been up to now? So, I asked the city for this data going back many years, but they told me the method for recording it had changed and it would be impossible to decipher anything meaningful from long-term trends. Not to be deterred, I took another route and talked to the people who ran the shelter waitlist, as well as those whose names were on it.
I interviewed providers, families experiencing homelessness, advocacy groups, legal aid organizations and faith-based groups who all said the same thing: Shelter beds listed as “vacant” were actually not available to hundreds of applicant families who were waiting for spots to open up. Staff at nonprofits that ran the shelters alleged that the city was intentionally undercounting the number of people who needed shelter, misleading the public.
“This unwillingness to capture the full scale of the problem means that there is not accountability to these families and there is, in turn, not public pressure to build the amount of shelter stock we need,” said Hope Kamer, director of public policy and external affairs at Compass Family Services.
Speaking with families experiencing homelessness further revealed to me how dire the problem was. Mothers of children with special needs shared the struggles they faced when sleeping on the streets or trying to live in congregate shelter. Some families were separated because a single shelter could not accommodate all members.
Fact-checking the public data dashboard became part of my story about this. I showed the complicated truth behind the seemingly clean, simple numbers that the city presented as a way to hold officials accountable. Over time, families began organizing to demand more emergency shelter beds and transparency from the city. After my story ran, their continued pressure alongside advocates and other media outlets led the Department of Homelessness and Supportive Housing to eventually increase the amount of shelter slots for families.
Sometimes, to better understand the city’s dashboards and what they measured, I requested related records and data that were not already published which might help me see the larger landscape. I wasn’t always successful, but what I did obtain proved difficult to weave together with what I’d already had in hand.
I had a particular interest in the Homeless Outreach Team, which is charged with connecting the city’s most vulnerable people with resources like housing. Having previously reported on the varied pathways by which people entered the city’s services system, I knew that thousands of people leave voicemails with the Homeless Outreach Team each year in their efforts to access shelter.
I asked for the logs of those voicemails to measure how quickly the city responded to people’s needs. Analyzing 18 months of data was initially challenging because the city’s logging method had changed over time. Using the coding language R, which I learned during the fellowship, I cleaned and synchronized the records to figure out how frequently teams had been dispatched. I discovered that dispatches almost entirely stopped in November 2023, but I wasn’t yet sure why.
Subsequent interviews revealed that those dispatches were only one aspect of the Homeless Outreach Team’s work, and that other outreach throughout the city was a core part of their daily duties. I lifted outreach data from their monthly homelessness response system reports.
Mapping these encounters since 2019 painted a picture of decreasing engagement between the team and unhoused people.
This data-driven conclusion would form the spine of my latest story, but I needed to know more to craft the narrative’s limbs. Why was outreach trending down, and what was the impact on people experiencing homelessness? I once again turned to my sources, interviewing city employees, people experiencing homelessness, their advocates, nonprofit service providers and others.
The answer that emerged was complicated: The team’s staffing woes, combined with officials’ decisions to shift workers away from their shorter, trust-building interactions to longer-term projects had caused their rate of public interactions to drop. One such project was a cleanup in advance of the Asia-Pacific Economic Cooperation (APEC) summit, a massive conference in November that hosted world leaders in downtown San Francisco. That was the same month that the outreach team’s dispatches, in response to voicemail requests for help, dropped to nearly zero — and those work logs cited the team’s APEC work as the reason.
Service providers and advocates expressed fear that officials’ political priorities were shifting the Homeless Outreach Team towards work that decreased the visibility of homelessness without actually helping people. They were also worried about the impacts of impending budget cuts to the team, as well as the recent U.S. Supreme Court decision in Grants Pass v. Johnson, which allowed cities to arrest, fine or force people who are living on the streets to move, even when shelter is not available.
In my story, I included data showing that encampment clearings had increased in the city as the Homeless Outreach Team’s field work had declined.
Piecing together different datasets and understanding how they fit together as part of a larger narrative took time, new data skills and shoe leather reporting. It reminded me why we need journalism: to help the public understand the whole story, which is usually bigger than a single data dashboard can tell. To hold our government officials accountable, we need to be scrutinizing how they present information and trends and, most importantly, provide resources to those most in need.