
How I learned to scrape data and use R to reveal problems in North Carolina’s psychiatric residential treatment facilities for kids

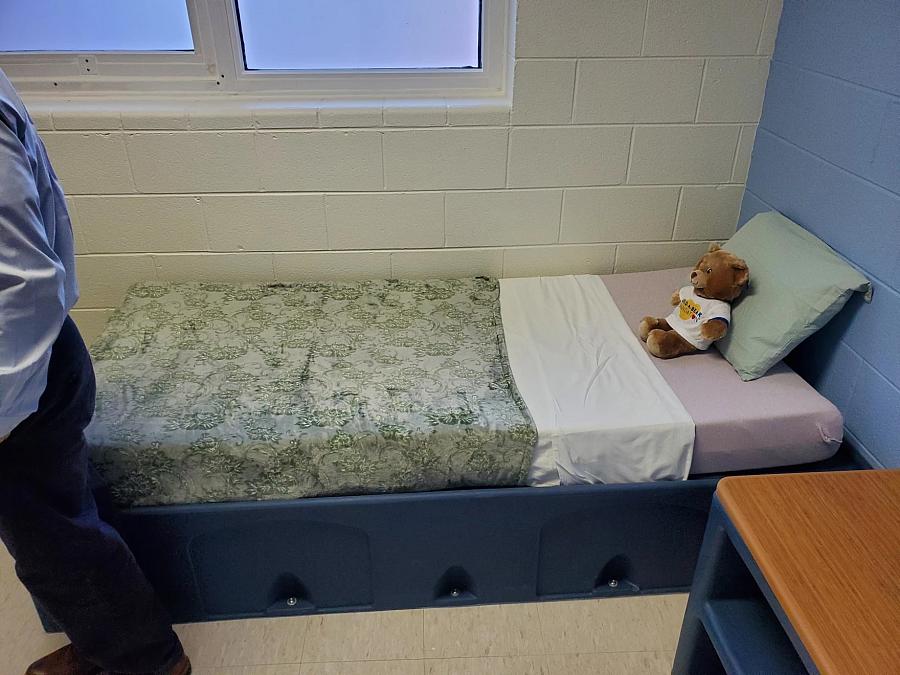
Ariel Wolf, featured in the author’s series, has bipolar disorder and spent time in a psychiatric residential treatment facility as a teen.
(Photo courtesy Jason deBruyn/WUNC)
Across North Carolina, children with severe psychiatric needs are among the most hidden people in our society. They often suffer in facilities unsuited to help them, and receive treatment that in many cases adds to their trauma.
When I set out to pursue my project of investigating these psychiatric residential treatment facilities, I knew that in one aspect of my data gathering, I was at a significant advantage. But in two others, I was going to need a lot of help.
Fortunately for me, my senior fellow knew exactly how to help me. I learned so much about how to incorporate web scraper tools and use new technology to unlock data analysis that I would not have otherwise been able to do.
Let me explain.
North Carolina regulators with the Department of Health and Human Services (DHHS) have a system in place for investigators to inspect these residential facilities. Each inspection produces a document that is posted to the DHHS website, available for anyone to find.
This is the big advantage that I had: I knew what data were available, and I knew where to find them.
However, the problem came in that each of these inspection reports were individual PDF documents, linked separately on the DHHS website. While this is helpful to find any one report, it is not helpful for making broad-based conclusions.
There were more than 500 reports that I needed to inspect. Downloading each individually presented a daunting task not only in terms of sheer labor, but also introduced a likelihood for omissions or duplicates. That's where program mentor Christian McDonald stepped in. He directed me to a web scraper called "Down Them All" that allowed me to run a script across the website and then simply click check boxes of the files that I wanted to pull.
Within just a few minutes, I went from having no inspection reports on my computer to having all of the ones I needed, perfectly sorted and all in order.
Step one was complete, but this still left me with the prospect of having to read through each report myself. In some cases, the inspection reports were 10 or more pages. Again, a daunting task to try to read through each report and try to make notations throughout in order to draw broad conclusions.
At this point, program mentor Andrew Tran stepped in to help. He taught me about Google Pinpoint, the program that can “read” PDF pages and then produce machine readable formats for all of those documents.
Fortunately, these inspection reports are filled out on forms and so they all have a similar layout. Tran helped me “teach” Google how to interpret these forms, which then meant that by simply training Google how to read one of the reports, it could then read all the other reports just as easily. This quickly turned every PDF into a machine-readable file, sorted in an Excel spreadsheet.
As anyone who has worked with data knows, this is an enormous help. Those two steps allowed me to run queries in R to analyze in a comprehensive way these reports. While I feel like I had good skills working in Excel, I was a complete novice working in R. With Tran's help, I was able to run data queries on the now-machine-readable inspection reports and draw broad-based conclusions.
It was this analysis that allowed me to report, for example, that facilities were cited for:
- 26 Type A-1 violations
- 1 Type A-2 violation
- 4 Type B violations
It further allowed me to count another 96 cited deficiencies, even if those deficiencies did not rise to the level of a violation.
It's worth stressing that children sent to these facilities suffer from severe psychiatric illnesses. In some cases, a child can experience a mental health episode that can trigger an investigation and inspection report. Without being able to take a broad view of the more than 20 facilities that provide treatment to these children, it's not possible to draw any conclusions about how children across North Carolina are faring as a whole. It's like trying to view a facility only through a keyhole — there are going to be lots of things you miss.
Having the data like this also allowed me to organize my stories in the right way. I always knew that I wanted to highlight the voices of children that experienced the insides of these facilities. But without a firm foundation built on these inspection reports, I ran the risk of my reporting being simply discarded as uncorroborated stories from a person with a mental health diagnosis.
Instead, in my first story, I was able to establish a fundamental and statewide flaw in the state's network of treatment facilities. That set the table for the second story, which went deep into the experiences of one family. Following with the third story that offered solutions on how to improve this system.
Again, all this was possible only because of the firm foundation that the data analysis of the inspection reports stood on.
Before joining the Data Fellowship program, I had done about a year of pre-reporting. I had a decent understanding of the landscape, and had spoken with several advocates and families about the myriad problems that children with mental health needs face. However I was never able to take on a project of this magnitude because I didn't have the necessary skills to make sense of the hundreds of inspection reports.
My project is a perfect example of the great reporting that can come out of simply giving reporters the right tools and skills to execute their vision. I'm so grateful to USC Center for Health Journalism and the Data Fellowship for giving me exactly that.