
How I showed toxic waste cleanups take longer in marginalized parts of the Bay Area

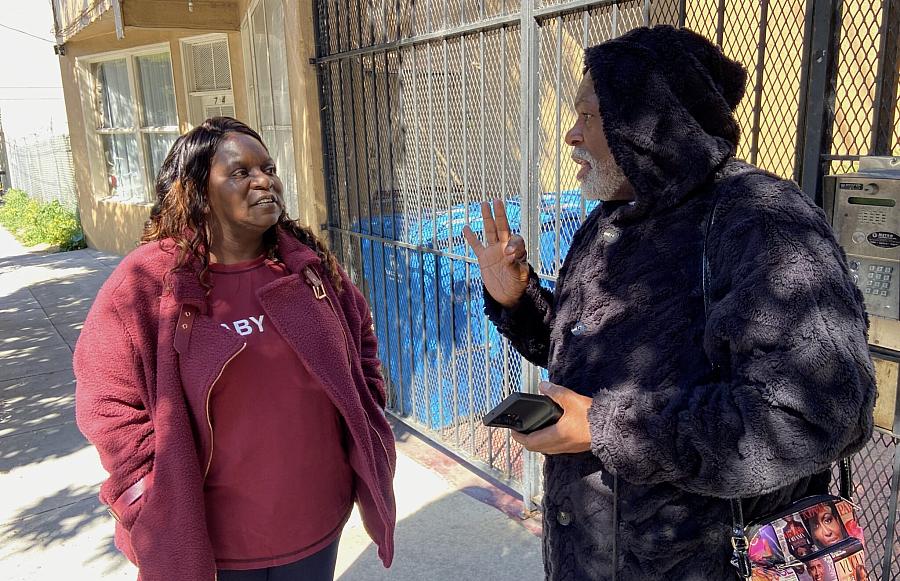
Arieann Harrison talks with resident Antoine Mahan about his concern that truck traffic to and from the Hunters Point Naval Shipyard may be worsening air quality along Innes Avenue in San Francisco, where he lives.
(Photo by Audrey Mei Yi Brown/San Francisco Public Press)
My recent reporting on toxic waste cleanups — and the big disparities in how they’re handled — got its start from talking to people living and working in Bay Area communities that are overburdened with pollution and hearing time and again about how long it takes to get toxic sites cleaned up.
These cleanups, taking place in communities from Bayview-Hunters Point in San Francisco to East Palo Alto to Richmond, have lasted decades and, in some cases, generations. Advocates, residents and researchers all told me they believed that cleanups take longer in marginalized communities compared with privileged ones.
The cost of slow cleanups is often high. Though the type and severity of pollution varies
widely depending on the kind of contamination a site has sustained, slow cleanups can add to the cumulative pollution burden on nearby residents. In the worst cases, residents were likely exposed to highly toxic contaminants that contributed to a wide variety of ailments ranging from nausea and dizziness to cancer.
To see whether there were measurable disparities in cleanup times, I needed a database that tracked how long it took to remediate toxic sites. This didn't exist, so I had to build it. Because site cleanups can fall under the jurisdiction of one of three agencies, I first had to make a dataset of all sites in the region that merged the databases of those three agencies: the federal EPA’s national priorities list, the state Water Board’s Geotracker, and the Department of Toxic Substances Control’s EnviroStor. That full dataset contained more than 20,000 toxic site cleanups. From there, I needed the duration of every cleanup. But duration was not tracked. I used the coding environment R Studio to calculate durations based on cleanup start and end dates.
In some cases, I had to work out the start and end dates based on a case’s first and last recorded activities. I then used R Studio and the geographic information system mapping software QGIS to analyze how cleanup times changed across census tracts.
I found that cleanups took longer in marginalized communities.
But I realized I had a new problem: the sites were too dissimilar to make a fair comparison
between the durations in marginalized neighborhoods of color compared to whiter, wealthier ones. In large part due to the legacy of redlining, the most severely polluted sites were concentrated in marginalized communities. In many cases, those highly contaminated sites take longer to clean up than the less polluted sites in well-off neighborhoods. Instead, I had to find a comparable subset of sites. I consulted advocates with extensive experience with toxic cleanups. One source suggested I consider looking at underground storage tanks, a type of site that peppers communities of all stripes. Often relics of old gas stations, the tanks typically leak petroleum into the surrounding soil and groundwater.
Such leaks cause relatively minor pollution and there is a consistent protocol for cleaning these sites up. Identifying that comparable subset of sites enabled me to make a fair comparison between cleanup times in wealthy, white neighborhoods and working-class communities of color. And it showed even clearer disparities in cleanup durations than the full dataset of all sites.
In a follow-up story that replicated the region-wide analysis for San Francisco, I found cleanups take far longer in the city’s neighborhoods of color compared to its affluent, majority-white neighborhoods. The city’s racial disparities were more pronounced than those for other large cities nearby and the region at large.
This data reporting was guided by John Harden, my senior fellow in the Data Fellowship and a metro data reporter at the Washington Post. As the data editor on the project, his mentorship and instruction were essential in enabling me to complete it.
Throughout the reporting, I talked with longtime residents and advocates in communities
overburdened with pollution to get their reaction to my findings and questions. I found their intimate knowledge of their communities and longtime experience with the cleanup system invaluable in helping me figure out what was going wrong, and at what scale.
Here are a few of my takeaways from this reporting journey.
Talk to people close to the issue and be open about your process and questions. Tap their expertise, as much as they are willing to share it. Though they were hard to get, I found interviews with state regulators extremely helpful in confirming my findings and better understanding some of the contributing factors to the disparities in cleanup times.
Push to get interviews with the agencies or entities responsible for the
problem you’re investigating. Even if it takes months to get that interview, don’t settle for a statement. Treat their technical experts as valuable sources too, and don’t be afraid to
bounce your ideas off of them. For instance, I talked with state regulators to confirm that underground storage tanks were a comparable subset of sites that would make for a fair analysis.
Seek republication with outlets that will help you reach your ideal audience. I wanted my story to reach people in Bayview-Hunters Point, a local working-class community of color affected by long cleanup times, and I also wanted to raise awareness of this local phenomenon with a national audience. Republication in the San Francisco Bay View National Black Newspaper and with Inside Climate News brought my story to these audiences.