Well Sourced: Map Medicare costs and types of care with Dartmouth Atlas

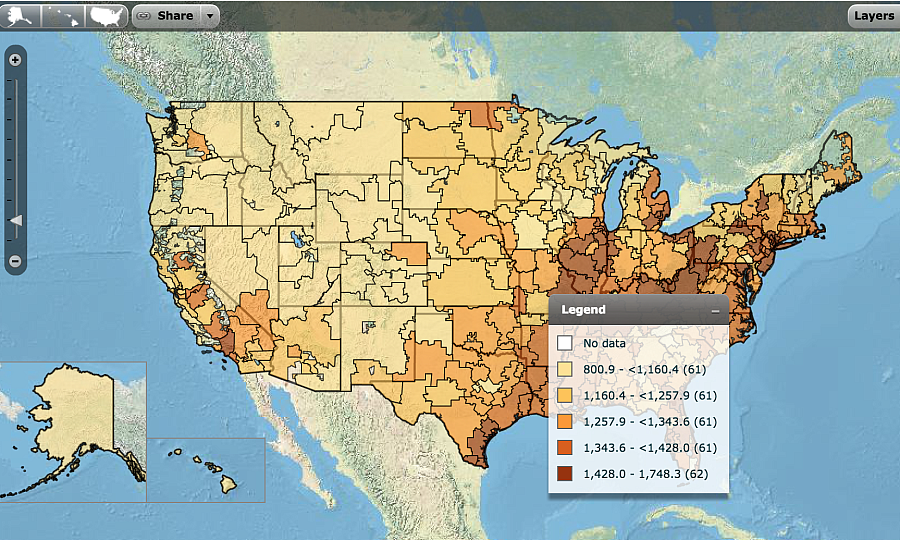
A map showing variation in hospital admissions per 1,000 decedents during the last six months of life. (Credit: Dartmouth Atlas)
It’s rare that you can know with certainty what the most powerful person in the world reads with his Cheerios, but during the beginning of the health reform debate, multiple news stories reported that President Barack Obama had read and then asked his staff to read Atul Gawande’s piece in The New Yorker, “The Cost Conundrum.”
The story famously explored the massive differences in health care spending between McAllen, Texas (super high), to places like Grand Junction, Colorado (quite low). Gawande wrote:
When you look across the spectrum from Grand Junction to McAllen—and the almost threefold difference in the costs of care—you come to realize that we are witnessing a battle for the soul of American medicine. Somewhere in the United States at this moment, a patient with chest pain, or a tumor, or a cough is seeing a doctor. And the damning question we have to ask is whether the doctor is set up to meet the needs of the patient, first and foremost, or to maximize revenue.
The story is probably the most widely known example of how to use the Dartmouth Atlas to explore the wide variation in health care utilization nationwide.
SOURCE: Dartmouth Atlas of Health Care
WHAT IT DOES: This ongoing research project coordinated by researchers at Dartmouth College in New Hampshire examines health care nationwide through the lens of Medicare spending. It shows that the kind, amount, quality, and cost of health care can vary dramatically across regions.
WHAT IT DOES NOT DO: Show how the Medicare population in an area relates to the overall population. According to the Kaiser Family Foundation, in Maine, for example, 21 percent of the population uses Medicare, while in Texas, Medicare patients represent just 12 percent.
RECORDS: You can use this site to see if your area has any unusual medical practices. This is especially useful if you cover one hospital in a large area. The Atlas team, for example, highlighted data on individual California hospitals and how they treat patients with chronic illnesses and at the end of life. It found that hospitals in Los Angeles spent far more than hospitals in other parts of the state and provided more treatments for patients during their dying days. Dartmouth research also has shown that more care doesn’t necessarily mean better care. Patients that get more care have a slightly higher death rate.
DRAWBACKS: There is a little bit of data overload here. If you’ve never looked at Medicare spending data before, it can be unclear which Medicare numbers mean what. The site makes you pick each hospital individually when comparing them, and that can be cumbersome. And it is so jargon heavy that most non-scientists won’t want to spend very much time with the data. Just as you begin to understand a term like “hospital care intensity” and spot a trend that seems interesting, you run into a term like “percentile of HCI index based on U.S. distribution.” And if you want to understand quality, you’re going to have to read one of Atlas’ reports that digs into both health care use and health care quality for topics such as end-of-life cancer care.
SUGGESTION: Try a few categories, comparing one hospital against others in the region and then others across the country, or an entire region versus another region in another part of the county. See if there are any strong variations. Talk to health care experts about what that might mean.
EXAMPLE:
Sarah Kliff at Vox, inspired by Gwande’s book on death and dying, wrote a piece that nicely used Dartmouth findings to make a key point:
Dying in America is expensive. The six percent of Medicare patients who die each year typically account for 27 to 30 percent of the program's annual health-care spending. During the last six months of life, the Dartmouth Atlas has found that the average Medicare patient spends 9.9 days in the hospital and 3.9 days in intensive care. Forty-two percent see 10 or more doctors.
So, if you want to understand more about how the people setting the national health policy agenda are making their decisions, spend some time with the Dartmouth Atlas.

