
Getting the data was the hard part. Asking standout schools how they were curbing bullying was easy.

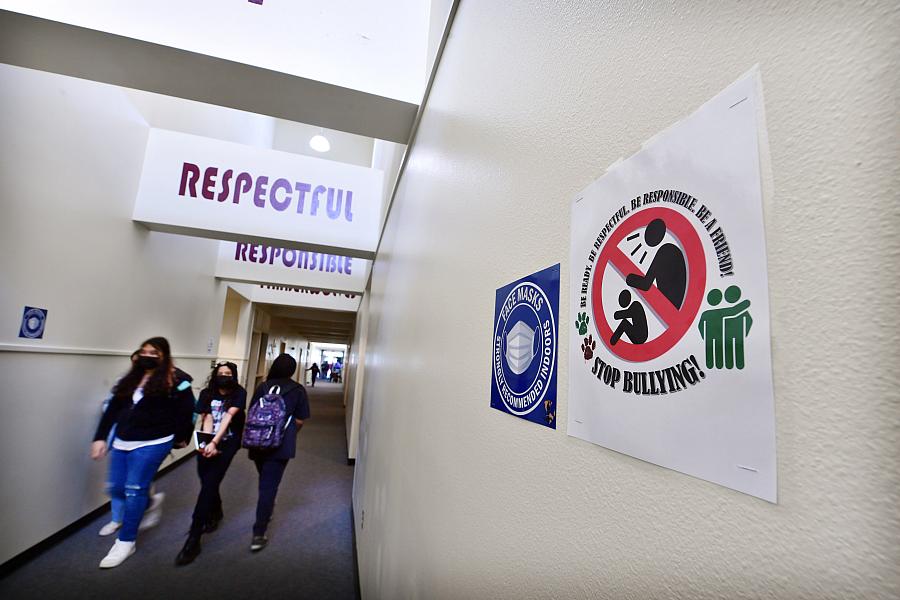
(Photo by Will Lester, Inland Valley Daily Bulletin/SCNG)
More and more educators agree that a school’s climate helps determine student success.
A student cannot learn unless they are happy, healthy, well-fed, and housed. That's why so many school districts around the United States now spend so much time on these issues. And to guide them, they use school climate surveys to determine student needs.
(Even if your state doesn't administer a survey, the federal Department of Education's National Center on Safe Supportive Learning Environments collects state-level data.)
In California, the most popular survey is the California Healthy Kids Survey. It’s given to students at about 70% of the state's roughly 1,000 public school districts.
It's in-depth, but it's not perfect. Primary students and secondary students are asked different questions, even on the same topic. But even just limiting my focus to responses from seventh, ninth and 11th graders across roughly 700 school districts provides a lot of valuable data.
I've used this data set twice. The first time was to look at suicidal thoughts reported by students. The second time, for the Center for Health Journalism's 2021 Data Fellowship project, to look at levels of reported bullying. In each case, I then used the data to look at what districts with the lowest reported levels in these anonymous surveys were doing that might explain the results.
There’s an online dashboard for this data, allowing the public to look at a wide variety of conditions in school districts across the state.
The problem is that the dashboard allows the public only to look up one district at a time, one year at a time. I wanted to look at more than a single year's worth of data, to smooth out statistical hiccups and get a more accurate look at what was happening in schools.
In theory, I could look up about 700 school districts five times each, recording the data I wanted after each time. But making 3,500 manual inquiries would be pointlessly time-consuming. (My newsroom, like many others, doesn't have nearly the manpower it once had, even if I was willing to do this manually.)
The good news is that those online dashboards run off a spreadsheet or database. The bad news is that those raw data files are seldom available with a single download. (It happens, and it’s a delight when you see it, but it’s rare.)
And there was an added complication. The survey isn’t conducted by the state — making it an inarguable public record — but instead, by a nonprofit.
The nonprofit, WestEd, is education-focused, so I suspected I'd find a sympathetic audience there. But the survey occupies a weird limbo. It's distributed by WestEd, but on behalf of the California Department of Education. They first had to figure out who could release the data to me.
Eventually, it became clear the state was handling the request. Then it was just a matter of getting the data.
My initial contact at the department of education — no longer there — at first insisted that the data dashboard was sufficient for the public’s needs. In other words, I'd need to make those 3,500 manual inquiries.
But the Healthy Kids survey dashboard runs on Tableau, an online data visualization tool that uses spreadsheet data. Getting a single spreadsheet with all the data would make life a lot easier than jumping through the same hoop 3,500 times. Once I was able to convince the spokesperson to actually check with the data folks, the files came soon after and were easy to work with. Getting to that point was the hard part.
Once I had the data in hand, the hard part was over, for both my suicide and bullying projects. Yes, the numbers had to be crunched to create an aggregate score over time, along with looking at changes over time, and outlier districts with tiny enrollments had to be excluded, but that was handled in a single work day.
After that, it was a matter of cold-calling districts with an atypically happy inquiry for a reporter to spring on government officials out of the blue:
“You’re doing something right, and making students’ lives better, and potentially saving lives. Tell me what you're doing, so other districts can do the same.”
Unsurprisingly, most districts were happy to respond and talk about their successes. In every case, officials said they had made conscious efforts to improve school climates. And they had concrete examples of the steps they were taking. The best news was that many of them told me the same things, meaning these were likely the elements that worked across districts.
Both projects were widely read and widely discussed among parents and educators. In the month since my bullying project was published, I've heard from school board members, teachers, families and a lawyer who represents severely bullied children. All had been looking for a toolbox of proven steps to reduce bullying in their school districts.
I’m hoping the next time someone looks at reported bullying levels among California students, we'll see a measurable decline.
Both the suicide and bullying projects were born out of tragedies. Four local students killed themselves in the first three weeks of the 2018-19 school year. A year later, a middle school boy was beaten to death by two bullies in September 2019, in the week that the bullying project was published.
My hope is that my work will mean fewer such tragedies happen in the future.