
How one reporter wrangled data from across Calif. to report on threat of toxic algae

")
Children play in water infested with blue-green algae at Silverwood Lake in San Bernardino County. (Photo credit: Watchara Phomicinda/ Southern California News Group)
I had fair warning that gathering data on blue-green algae toxins in California was going to be an uphill battle.
“It’s not easy to get everybody to share data,” Karen Taberski, a senior environmental scientist for the State Water Resources Control Board, told me in December.
The toxins, known as cyanotoxins, sicken people and animals and have been linked to the deaths of dogs across the country. But because there are no regulations to monitor the toxin levels in recreational water and drinking water supplies, it’s difficult to know where the toxins are being found and who is tracking them.
For my project as a California Health Data fellow, I wanted to get a better understanding of how prevalent these toxins were in the state and to create a map to show where the toxins have been detected, but first I had to figure out where to look for data.
I started out by doing some initial research online and learned that there were several groups and laboratories, including the U.S. Environmental Protection Agency’s facility in Richmond, Calif., that had data and that some water districts had tested for the toxins in the past.
But in order to get a real understanding of the scope of the problem, I needed to reach out to officials all over the state, so I filed California Public Records Act requests for any memos, studies and data on cyanotoxins with health departments for each of the state’s 58 counties.
Over the course of several weeks, I slowly heard from county officials all over the state.
“The department does not have any records responsive to your request.”
It was a response I heard over and over again. Officials in some counties where I knew toxic algal blooms had been reported were even telling me they knew nothing about it.
Only a few counties had information or data on the toxins but what they could tell me just led me to other agencies.
For example, while officials at the Los Angeles County Department of Public Health did not have any toxin data, an email I received in their records response indicated that the California Department of Water Resources was tracking the toxins in at least one reservoir in the county.
So, in addition to filing records requests with the state’s nine regional water boards, I requested data from the water resources department.
A month and a half later, I finally heard back from the department. Not only did the department have data on cyanotoxins, but it also had data for water bodies across the state.
Combining data from a few counties, the EPA laboratory, several regional water boards and the Department of Water Resources, I had a few thousand rows of toxin test results for a five-year period.
The data was not perfect. Some numbers had greater than or less than symbols attached to them. And the majority of the water samples had no geographic coordinates associated with them.
How was I supposed to make a map of toxin levels with no idea where the toxins were detected?
It took some time — lots of time — but in the end I was able to find sample locations using various water quality databases, park maps and a USGS map to identify and locate different water bodies.
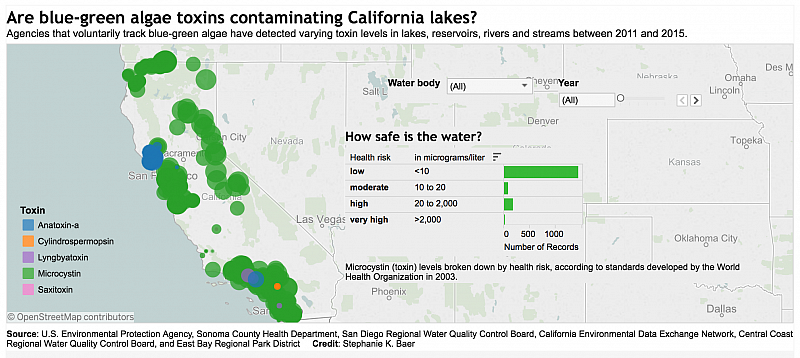
I couldn’t find coordinates for every data point, and that was OK — even without mapping some of the data I was able to illustrate how widespread the problem was: Toxin levels exceeded proposed safety thresholds in more than 100 lakes, reservoirs and streams in at least 36 counties.
Karen Taberski, the environmental scientist, was right. It was not easy to collect the data.
I was not able to collect all the data that was out there. And because each agency organized the data in different ways, I had to develop a format to standardize each data set by.
With that in mind, here’s my advice to anyone compiling data from various agencies:
- Don't be afraid to pick up the phone — if you don't understand the way someone’s data is organized or need more information about it, ask them to explain.
- Figure out what you want to do with the data before coming up with a format for how to organize it. In my case, I needed separate data points for each toxin that was analyzed, so that meant breaking down rows that were organized by date into multiple rows, one for each toxin analyzed.
- Break it down into a few columns. If you’re dealing with data from multiple agencies, chances are they won’t provide you with all the same information (i.e. sample depth, the type of test used, etc.). Stick with a few like columns when combining each data set.
- Explain to sources what you're doing with the data you're requesting. The more your sources know about what you plan to do with the data they’re providing, the more they will be willing to get you the information you need.
Read Stephanie Baer’s California Data Fellowship stories here.