
How data powered every step of the reporting on absenteeism in Calif. schools

(Photo by Julie Leopo/EdSource)
We were about 30 seconds into our first look at the California Department of Education’s chronic absenteeism data when we knew what our story would be.
All it took was one sort. It showed that the 10 school districts in the state with the highest rates of chronic absenteeism were all in rural areas. Less than a minute later we realized that among the 100 districts statewide with the highest rates, 85 were rural districts.
So that was that. We hit save and close on the Excel table and let the story write itself. Well, not exactly.
This initial sort certainly gave us a good sense of the what and the where. But it didn’t give us much of an inkling at all into the why and the how. Answers to those questions required many hours of analysis with several data sets along with months of research and on-the-ground reporting.
First, we had to get our arms around the scope of rural California. When people think of the Golden State, the metropolises of Los Angeles and the Bay Area usually come to mind. But it has about 5 million rural residents, more than any other state. And its geography — the coast, the mountains, the valleys and deserts — is just as diverse as its people.
Our analysis showed that every corner of California was touched by chronic absenteeism. Among the 10 districts with the highest rates was a district in Death Valley, a couple in the northern coastal region and several in the Sierra Nevada mountains.
Finding the right place
We chose to focus on Butte County because it is home to two of the five districts with the highest rates statewide and it has a good mix of small towns and remote areas. We also felt it was important to focus on Butte because it was struck last November by the Camp Fire, the deadliest wildfire in California history, which has exacerbated the county’s absenteeism crisis.
Our next task was to get to know Butte County — its history, its demographics and the daily realities of its people. To do this we needed data beyond the chronic absenteeism records. Our sources included: The U.S. Census Bureau, FBI Uniform Crime Reports, the U.S. Bureau of Labor Statistics, and county-level reports on adverse childhood experiences.
We benefited greatly from previous work done by Paul Overberg and Janet Adamy in the Wall Street Journal. They analyzed these data sets and others for a 2017 piece that showed how rural America has become the new “inner city.”
Analysis never stops
This is a good spot to note that doing the bulk of the data analysis before our reporting trips to Butte County was important. Our knowledge of the demographics of the county and the details on crime and childhood trauma gave us a good sense of who to talk to and informed our interviews. However, just like the reporting on a story doesn’t stop until it runs, neither should the data work.
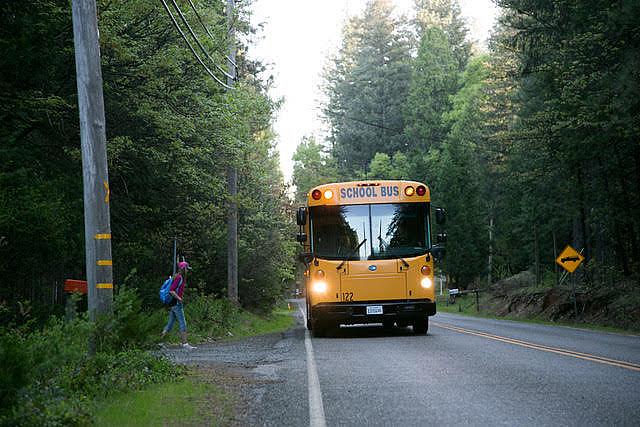
A case in point is our discovery of Stirling City, a tiny place in the far reaches of Butte County. We didn’t learn about Stirling City until we were on the ground, but once we did we realized it would be central to one of our stories. Several of the chronically absent students we came in contact with were from Stirling City, and census data helped us explain why. Here is an excerpt from the story:
Stirling City is at the top of the ridge and the last stop on the bus route. Streets with names like “Quartz,” “Diamond” and “Oak” hint at its former glory as a hub of the region’s mining and timber industries through much of the 20th century.
Today, Stirling City is in a state of decay. It no longer has any businesses — not even a corner market — and is home to a diminishing number of working-age people. Of the town’s 201 residents, more than 80 percent are either under 20 or 65 and over, according to the most recent Census estimates.
It’s a small nugget, but the data really helped us give the reader a sense of the place.
Missing data
Often with a big project, there’s the story you get and the story you didn’t get. The smoking gun document that you’d heard existed but never materialized. The victim who promised to talk to you but backed out. In our case, it was the database that the state has but wouldn’t give to us.
During the early stages of our reporting, we learned that the chronic absenteeism data the state had made public didn’t show the whole picture. When school districts report absenteeism data to the state, they break it down by excused absences, unexcused absences and absences due to suspensions.
For obvious reasons, the breakdowns are key to fully understanding the problem. If, for example, a large percentage of missing days by chronically absent students are excused, it could be due to a lack of access to health care or high asthma rates. If suspensions are the reason for a higher-than-average number of days missed by chronically absent students in a particular school or district, then their discipline policies warrant examination.
We filed a request for this data under the California Public Records Act in early December. State officials responded by saying they have the data and plan to release it at some point in the future. But they refused to give us a timeframe.
This, of course, was unacceptable to us and we appealed the decision. This led to months of back and forth without any real progress. By late March, we decided we would have to go ahead without the data and hopefully have it for follow-up stories later in the year.
The stories and the interactive map we created certainly would have packed a more powerful punch with the data breakdowns. That being said, the series we did produce was impactful and laid a strong foundation for future reporting on the issue.