

How data turned anecdotes on Baltimore student commutes into a Pulitzer-finalist series

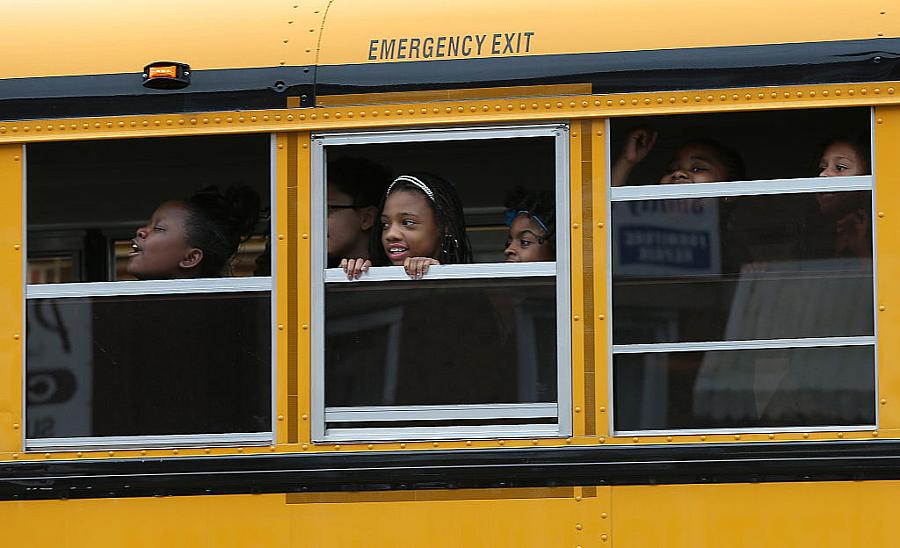
(Photo by Win McNamee/Getty Images)
Journalist Greg Morton was only 28 when he published the first article in a groundbreaking data-driven investigation that would ultimately make him a Pulitzer Prize finalist.
His “Transit Nightmare” series, published in The Baltimore Banner, exposed how the city’s public transit system fails to provide a safe or dependable ride to school for students, derailing their access to education as well as their future college and career plans.
The hurdles Morton faced gathering the data necessary to prove a connection between long transit journeys and harmful outcomes for students would seem, to many reporters, insurmountable.
For starters, neither the Maryland Transit Administration nor the public school system knew how many students get to school using public transportation. There was also no data available on the routes students were taking or on when, where and for how long trains and buses were delayed during their commutes.
Despite those gaps, Morton and his colleagues Liz Bowie, Ryan Little and Allan James Vestal were able to wrap their arms around this “white whale” story and demonstrate how Baltimore’s transit and education systems are failing thousands of students.
Morton, now data editor at the Banner, shared the strategies they used during his keynote address at the Center for Health Journalism’s 2026 Data Fellowship in Los Angeles this week.
“My honest advice: You can do anything that you put your mind to,” he told this year’s fellows. “I really believe as long as you work hard and apply yourself, you can do it.”
The original idea for the award-winning project came from education reporter Liz Bowie, who had anecdotal examples of students who faced incredibly lengthy and unreliable journeys to school. She also had stories of how unwieldy commutes either influenced students’ decisions to transfer to a closer and less academically rigorous school or led to them failing their first-period classes because they couldn’t get to school on time.
What she didn’t have was data proving that this was a systemic problem. That is where Morton came in.
“My job in this investigation was to connect each of those student experiences to patterns that we were observing in the data,” he said. “An anecdotal story is good; a data-driven story with strong characters really helps make an emotional impact and a case for change.”
Baltimore’s public school system is unusual in that after elementary school, there are no more neighborhood schools.
“Baltimore’s school choice system is designed as an egalitarian system to give kids who might be from poorer parts of the city access to elite schools as long as they work hard,” Morton said. “But what it doesn't afford them is an equal opportunity to get to school.”
Because the city has neither a reliable school bus nor public transportation network, students as young as 11 are starting their journeys to school as early as 5:40 a.m., with no guarantee that they will be in their seats when first period starts at 7:30 a.m., the investigation found.
When pursuing an ambitious project like this one, it is helpful to begin by breaking down the problem into bite-sized questions, he said. The two key questions he sought to answer were: How long are students’ trips to school and how often do they go wrong?
The lack of data on how many students were using public transportation to come to school inspired him to look for opportunities to create his own data. “Collecting your own data can really help teach you about something you didn't know about before and can also put you in a position to say something that no one else can say,” he said.
After a protracted public records battle with the school system, Morton and his colleagues gained access to a dataset containing a home census tract and destination school for every student across the city.
This, for me, is where a lot of the magic happens. We turn those anecdotal findings into really specific, really muscular, really actionable data sentences that ultimately end up in the story. — Greg Morton, The Baltimore Banner
Then, they had to find a way to turn all that data into the likeliest public transit journey each student used to get to school. This was a task that Morton had no clue how to accomplish, so he employed one of his favorite data journalism strategies: deputizing experts.
“Get people in on your mission and ask for help crafting the methodology that you're going to use to tell a story like this,” he said.
Morton enlisted the help of researcher Marc Stein, who had studied the trouble students face in getting to school while serving as a professor of education policy at Johns Hopkins University. Stein not only referred Morton to other experts to speak to, but also helped him figure out a model to map out each student’s likeliest transit journey.
One of Morton’s other top tips is to continuously engage stakeholders throughout the research process. For this story he was in constant contact with the MTA and school system, a decision that ultimately saved him a lot of time, he noted.
For example, at one point he had purchased data on bus locations from a man who ran an open-source data website, but when he brought that data to the MTA, he was informed that it was highly inaccurate.
Another of his tips for reporters is to pause periodically throughout the data analysis process and start translating numerical observations into digestible sentences.
“This, for me, is where a lot of the magic happens,” he said. “We turn those anecdotal findings into really specific, really muscular, really actionable data sentences that ultimately end up in the story.”
For example, it’s one thing to say some kids in Baltimore have really long rides to school. It’s another to say that the average student’s trip to school is around 40 minutes, longer than the average adult’s commute.
Another key data journalism move is being able to tie together two unrelated datasets, he said. For example, he wrote about how the citywide failure rate for high school classes was nearly 7 percentage points higher for first-period classes, when many students are arriving at school, than in other periods.
He also noted how students’ earliest trips begin at the far edges of the city as early as 5:40 a.m.
“That’s a very different sentence than a lot of kids getting up early to go to school,” he said. “This is really the power of data journalism.”
With data on students’ transit journeys in hand, it was then time to verify it with real-world stories and experiences of students. This, for Morton, was where the human impact of the project hit home.
At first he found the data showing the starting times of some kids' transit journeys hard to believe. But by following the journey of students like A'Nya Lucas, who set her first alarm at 5:10 a.m. in the hopes of arriving at school by the time school starts, he saw that the team’s analysis was indeed correct.
“To see this number on the screen — that I looked at for the first time and said this cannot possibly be right — connected to an actual kid’s story, was a pretty emotional and pretty resonant moment for me,” he said.
The reporting team employed powerful data visualizations that not only mapped out A’Nya’s path to school but also modeled those of the other students in the dataset.
He then extended his reporting by matching the data showing long journeys to the harmful impact on students.
For example, he reported on how students with long commutes to top schools are more likely to transfer to closer and less prestigious schools — as well as how this ultimately affected the academic programs they had access to and the colleges they were able to attend.
Lastly, Morton and his team decided to use all the data they had gathered throughout the investigation to design a yellow bus network capable of transporting all of Baltimore’s secondary students to school.
“We didn’t feel that it was enough to just describe the problem,” he said. “We wanted to lend our expertise towards finding a solution.”
It’s a lens he encouraged fellow journalists to apply to their research as they embark on their own data-driven investigations.