
People are bypassing tap water in many communities. Reporters can explore why — and what needs to change

(Photo by Jabin Botsford/The Washington Post via Getty Images)
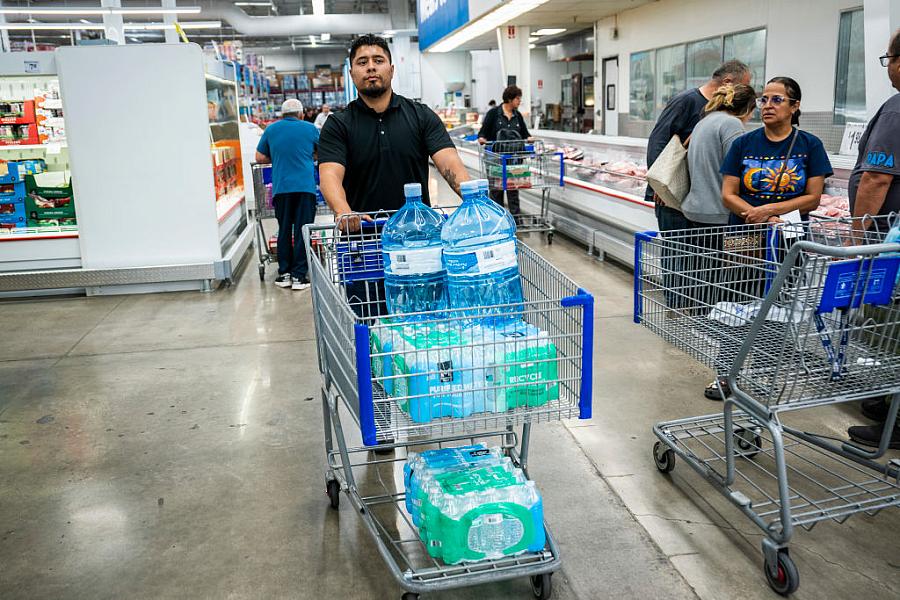
Water vending machines — dispensers that filter and treat tap water before selling it by the gallon — are a regular feature of convenience stores and strip malls around Southern California. You might even frequent one yourself.
I wanted to understand the degree to which people turn to machines like these because they’re concerned that tap water isn’t good for their health. Highly publicized crises in cities like Flint, Michigan, Jackson, Mississippi and Los Angeles, California may give consumers legitimate reason to question their own community’s drinking water infrastructure.
The evidence on whether U.S. consumers trust their tap water is mixed. A strong majority of adults consider water at their faucets safe, but the share who say it is “very” or “somewhat” safe has dropped from 81% to 72% since 2020, according to a recent survey on behalf of the American Water Works Association.
I started my reporting project, under the auspices of the 2024 California Health Equity Fellowship, with data analysis. The California Department of Public Health is the agency that licenses water vending machines, so I placed a records request for the locations of every machine licensed in the state. The department sent me a spreadsheet of data with the machines’ street addresses, which I geocoded so that I could count the number of vending machines in each census tract in the state. That made it possible to calculate the ratio of machines to people in different neighborhoods and to pull in other demographic and socioeconomic facts.
The first story in the project focused on San Diego County, which I found had more water vending machines per person than neighbors like Los Angeles and Riverside counties. This might seem counterintuitive. The city of San Diego’s tap water generally complies with public health standards. Vended water is much pricier than tap on a per gallon basis, too.
Looking more deeply, I found there tended to be more water vending machines per person in San Diego County neighborhoods with lower incomes and rates of college attainment, and higher shares of rental units, non-citizens and Latinos — patterns that reflect what social scientists have observed in other cities.
How come? Some researchers argue that consumers distrust their tap water because they’re aware of water utilities failing in other communities, a sentiment that was echoed by a handful of customers I interviewed. San Diego residents need not look very far to find tap water providers that have struggled to meet state or federal standards.
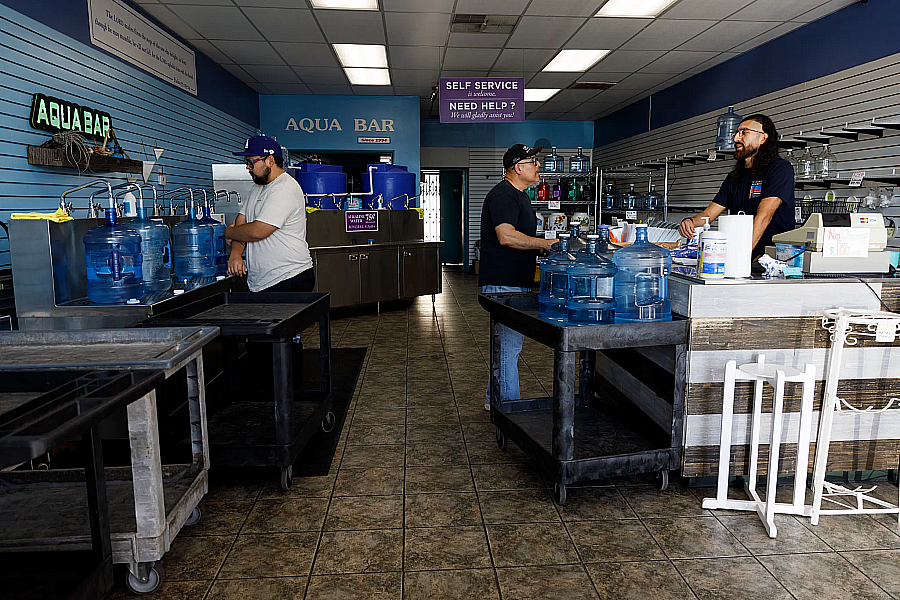
Joe Anthony Perez, right, tends to customers at Aqua Bar in Escondido on October 25, 2024.
(Photo by Kristian Carreon for Voice of San Diego)
“You could go north into the Central Valley of California, and you're going to find lots of places with drinking water in poor condition or failing conditions in communities that are going to have generally high Hispanic/Latino and/or low-income populations,” Manny Teodoro, a researcher at the University of Wisconsin-Madison who has studied the water vending machine industry, told me.
I began to wonder what that distrust could mean for consumer health. It turns out that avoiding or disliking tap water has been linked to habits that can have negative downstream health effects, like swapping water for sugary beverages or drinking less water overall.
To learn more, I needed to talk to people who frequent water vending machines. Working with María Inés Zamudio, my former colleague at the Center for Public Integrity, I posted fliers soliciting sources in some of the Los Angeles County neighborhoods with the most water vending machines per person. I continued this strategy in San Diego County.
When only one customer responded to a flier, I decided to change tactics. Equipped with a clipboard and a short interview template, I posted up at high-traffic strip malls with multiple vending machines located side by side, spending an hour or two at each one. This worked better: I ultimately interviewed more than a dozen customers.
And the more people I interviewed, the more I learned that people are often deeply curious about the health and safety of their water. Monica Vaughan, who coached me as a senior fellow, recommended that I learn a few facts about local water quality, so that I could answer my sources’ basic questions. I also placed a QR code on my interview template that linked to a California State Water Resources Control Board website where users can lookup water testing results, annual reports and any recent enforcement actions. Having the QR code as a prop made the reporting process a little more reciprocal; I was giving sources information, not just taking information from them.
I also wrote a second piece that sought to answer questions I was hearing from customers who frequently purchase jugs of water from a vending machine. This article explained how the machines are supposed to work and reviewed annual reports that suggest they are not inspected by public health authorities very frequently. The piece in addition summarized a recent study that found poorly maintained vending machines may not always function as advertised, sometimes dispensing water that tested positive for bacteria and other times failing to remove residual chlorine. Finally, I collected a few tips for customers, such as how to see the date a machine was last serviced and check if the machine’s spigot looks clean.
My reporting only scratches the surface of understanding what drives people to prefer vended water. It could be that people can taste, smell or see something odd in the water flowing from their home faucets, an issue that public water agencies could address by adjusting their treatment techniques. Or perhaps consumers are noticing something awry with the premise plumbing that delivers water from the meter to the sinks in their homes. If we don’t ask why people distrust their tap water, we’ll never know — and we’ll never understand the underlying reasons people spend more for private water alternatives.
I see more opportunities for reporters to approach this topic using the many rich data sources available about drinking water, including this map of water system service boundaries and the Safe Drinking Water Information System. To encourage more journalists and researchers to investigate this topic, I’ve also written a one-page methodology piece explaining how I acquired, standardized and geocoded the locations of water vending machines in California, merging this data with variables available through the American Community Survey.