
The Washington Post’s Akilah Johnson shares strategies for grounding narratives in data

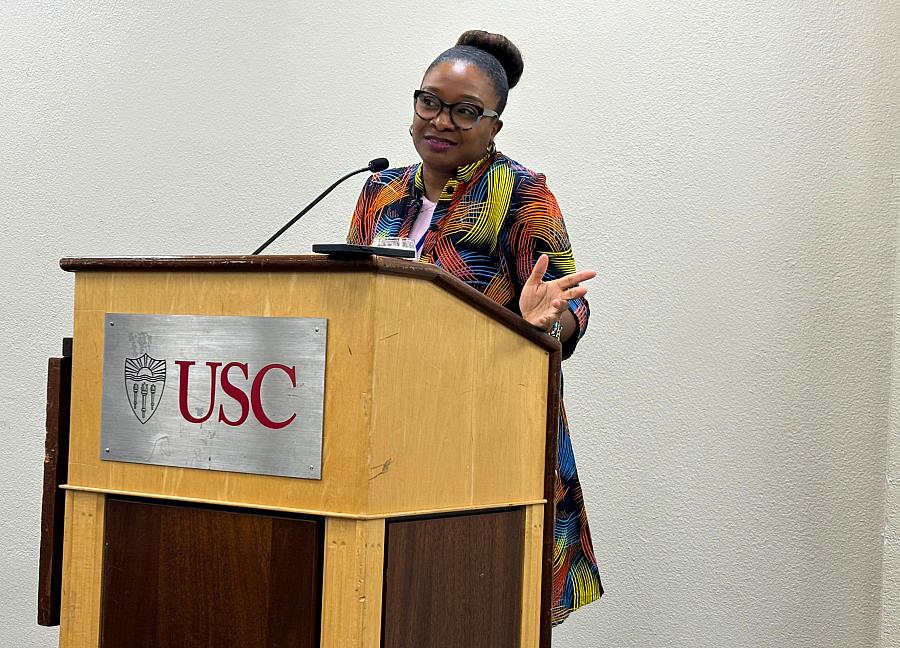
Akilah Johnson, a national reporter for The Washington Post, delivers the keynote address at the 2024 Data Fellowship in Los Angeles on Oct. 7, 2024.
Data can show the scope of an issue, but numbers alone cannot communicate the human impacts of a story.
“The pandemic changed me. It showed me that having no data can be just as harmful as doing data for data’s sake,” said Akilah Johnson, a national reporter focusing on health disparities for The Washington Post.
Johnson has deep experience covering racism, social inequalities, immigration and health. She shared lessons from her career on how data, when thoughtfully partnered with narratives, can amplify and transform stories during her keynote address to journalists taking part in the Center for Health Journalism’s 2024 Data Fellowship in Los Angeles this week.
“More and more reporters were being told and trained to add data skills to their tool kits, while shoe-leather reporting techniques were becoming relics of the past,” said Johnson, reflecting on her time living in Silicon Valley among tech entrepreneurs as a John S. Knight fellow at Stanford University.
Johnson was a relatively new health reporter at ProPublica when the COVID-19 pandemic hit the United States in 2020. “I had an immediate desire to go and bear witness, to tell the story of those suffering … not to seek out data on who was dying,” Johnson recalled.
She focused on who was getting sick and dying, the impact on communities of color and those living in poverty and why was this happening.
“Much of the conversation in March 2020 seemed to be about two things — the coronavirus was the great equalizer and the data, or lack thereof.”
But the coronavirus was not impacting everyone equally. Based on her conversations in the community, she knew people in historically marginalized areas were bearing a heavy burden of infections and deaths.
Johnson reached out to a trusted source, Dr. James Jennings, emeritus professor of urban and environmental policy at Tufts University, for help in understanding the reasons for the disparities.
Jennings told her she needed data broken down by race and ethnicity to unpack the economic, environmental and political inequities that the virus was laying bare. The Centers for Disease Control and Preventions was not yet reporting data by race and ethnicity. One of the agency’s early surveillance reports was not published until June 2020.
In April 2020, Johnson and her ProPublica reporting partner Talia Buford “scoured online databases, coroners’ websites and COVID dashboards,” among other sources, to find race and ethnicity data of those affected by the virus. They discovered an alarming rate of coronavirus infections and deaths among Black Americans, in the few areas with available race and ethnicity data. For example, in Milwaukee, where about one-fourth of the population was Black, 81% of deaths were Black.
“This helped crystalize, for me, the concept of ‘data as evidence,’” said Johnson.
She said she uses her beat reporter skills for finding and talking with people who can tell their stories, which add context and significance when merged with supporting data. She and her data partner, Dan Keating, used this approach for their 2023 project at The Washington Post on the premature death crisis in the United States.
The dataset that powered that investigation was huge, drawing upon death records from 10 states, countries in Europe and South America, health statistics from the federal government and peer nations, and even funeral notices, to identify sources. Keating prepared multiple graphs that showed strong correlations between death rates and factors such as income, education, poverty and geography.
Johnson said, “Essentially, I was playing interpreter, sifting through raw material and making it more accessible for myself, for our team and ultimately, for our readers.”
She talked to countless experts, clinicians and people affected by the loss of loved ones. The project took nearly a year.
To handle such large amounts of information, she uses a strategy called “flare and focus,” which she describes as the shape of an hourglass. The “flare” is the wide bulb of information, and the “focus” is the narrowing conduit that separates out key points that ultimately make it into the article.
The data showed that early deaths among people 35 to 64 were primarily related to chronic diseases, and the rates were strikingly different between residents of wealthy and poor communities.
“Behind all the mortality statistics were personal stories of loss, grief, hope and anger,” said Johnson.
“By grounding narratives in data and historical context, you give anecdotes — people’s stories — credibility,” she said, “Data helps show the systemic nature of inequality.”