In data reporting, don’t let quest for numbers eclipse the people at the heart of the story

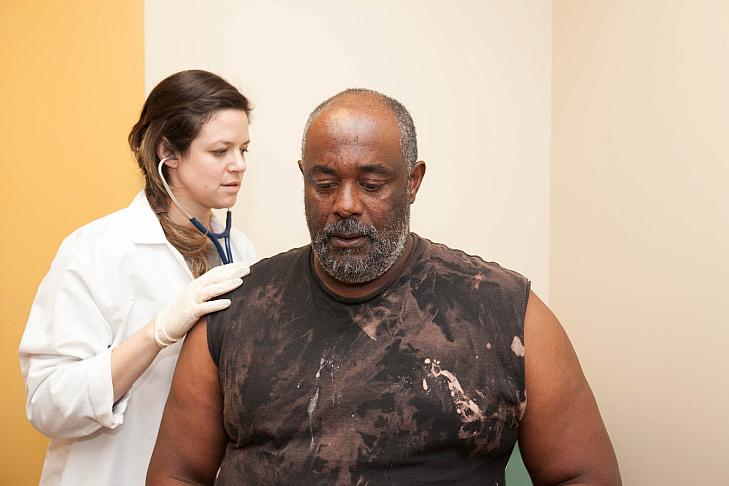
Dr. Samantha Smith checks on 58-year-old patient Paul Shelton. He has severe liver scarring as a result of hepatitis C, but his insurance company has denied his request for treatment at least twice. (Photo courtesy Susanica Tam/KPCC)
Earlier this year, I set out to paint a picture of how Californians’ access to highly effective hepatitis C treatments is impeded by the sky-high cost of the drugs.
My plan was to collect data from Medi-Cal, California’s Medicaid program. I wanted to look at how many people were approved or denied for treatment, and what happened when people appealed denials of treatment. I also intended to get as much demographic data as possible.
But in the process of doing this reporting for my California Data Fellowship project, I fell down a data rabbit hole.
I was determined to get the most complete datasets possible, so I could accurately analyze the situation and draw conclusions for my story. The problem is, these data blinders prevented me from seeing the full story and its rich cast of characters.
Here are some of the roadblocks I hit and what I’d do differently next time:
Organize the data: I was trying to juggle the demands of daily health reporting and long-term reporting on this project. On many mornings, I would fire off a request for data or a follow-up question, before getting pulled off to breaking news. At one point, I realized I had requested data that an agency had already given me — a month earlier! This signaled to me that I’d allowed the data-collection process to drag on for too long. It also revealed that I needed a better way of organizing the data that I’d already received!
Interview the data: I was so consumed with acquiring data that I didn’t step back and ask the bigger questions. In the process of trying to drill down on the number of people who received treatment for hepatitis C, I forgot to ask: Why, besides the cost of the medication, are so few people getting treatment? Once I considered that question, I discovered several more rich story possibilities.
The data is not the destination: Again, because I was so focused on collecting and analyzing data, I let the human side of this story become an afterthought. Next time I do a data-driven story, I’ll use data to discover general trends and then spend the bulk of my time developing character-driven narratives that illuminate these trends.
I eventually climbed out of my data rabbit hole. With the help of my editors and colleagues, I zeroed in on some key data points:
- The state adopted new hepatitis C treatment guidelines in July 2015. These new rules said that people with light liver scarring, as well as those who have severe scarring and cirrhosis, were eligible to receive medication. KPCC’s analysis of state data found that the rate of people denied the drugs in one Medi-Cal program dropped from almost two-thirds to just under one-half after the new treatment policy took effect.
- Despite the less restrictive rules, just 6,460 of the estimated 250,000 Medi-Cal members with hepatitis C received the new and expensive drugs between December 31, 2013 and March 31 of this year, according to the California Department of Health Care Services.
- Treating that relatively small group cost the state nearly $590 million.
- I also connected with the nonprofit St. John's Well Child and Family Center. I had the chance to meet people with hepatitis C and the medical team dedicated to treating them. This allowed me to understand my data through the voices and experiences of real people.
One of the joys of journalism is that as you report one story, you discover others. Next, I’m interested in digging into why — beyond issues of cost — such a very small percentage of people in Medi-Cal have been treated for hepatitis C.
**
Read Rebecca Plevin's California Data Fellowship stories here.

