
FiveThirtyEight’s Anna Barry-Jester on how she reported the story of big disparities in South’s Black Belt

Anna Barry-Jester has always been interested in social determinants of health. She has reported on Appalachia and on the Midwest, where she said people were realizing the connections between structural factors — a plant closing, for instance — and worsening health outcomes.
But as much as Barry-Jester was tracking a conversation about rural white America, she didn’t hear the same kind of stories about the rural places where African-Americans lived.
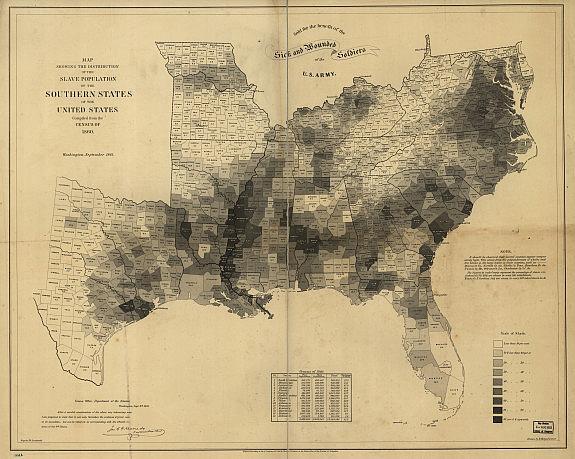
In map after map of health outcomes, the areas that lit up the most — where people were dying young of preventable diseases, or infants weren’t surviving their first year — were along a zone called the Black Belt. (The name refers to the fertile soil that drew white colonists and plantations centuries ago.)
The Black Belt stretches from parts of Texas through the Deep South to the coast of Georgia, and it’s historically where the largest numbers of slaves lived — and where more than 80 percent of rural black Americans live today. Black men in the region routinely have mortality rates 50 percent higher than the national average.
“I was really interested in the question of how slavery and historic institutions play out in health outcomes today,” said Barry-Jester, a senior reporter with FiveThirtyEight and a 2016 National Health Fellow. She spoke to 2017 National Fellows this week about her project, a series of three stories with interactive components on FiveThirtyEight that probed the reasons why such large health disparities exist in the Black Belt.
One problem the Black Belt is facing is shared by other parts of rural America — rural hospitals are closing, leaving many patients behind to fend for themselves. Added to this, there is a mistrust of doctors. Barry-Jester reported on people like Dr. Remona Peterson, an African-American doctor who grew up in rural Alabama and wants to be part of positive change in the region. Peterson, who had just finished residency, will start working in a few weeks.
Anna Barry-Jester speaks to 2017 National Fellows this week.
In her reporting, which took her on three trips to different parts of the region over three weeks, Barry-Jester looked for people who could illustrate the trends. FiveThirtyEight works heavily in data, she explained, which grounds their stories. But such an approach can also pose challenges.
“Data can be really cold, lacking in humanity. But that was not the approach we wanted to take with these stories,” she said.
Typically, Barry-Jester would travel into a community and spend a lot of time with one person, delving deeply into their story. But for her fellowship stories, Barry-Jester went a different direction: She spent time with a variety of people, and wove multiple anecdotes into the stories.
Barry-Jester told fellows that she spent much of her time listening — especially to groups of people — during her reporting trips. “There’s a challenge being a so-called parachute journalist, going into a place with a complicated history that’s not my community,” she said. “I tried to spend as much time in community situations as possible. I went to church on Sunday a lot.” She also attended community meal programs and spent time with a farming cooperative.
“I wasn’t going to be able to tell somebody’s story in the depth it would take, and I wasn’t going to be able to be in constant touch with these families, so we incorporated more people and perspectives into the story,” she said.
One of Barry-Jester’s FiveThirtyEight colleagues, Ella Koeze, built an interactive map — “35 Years Of American Death” — using data from the Institute for Health Metrics and Evaluation that shows mortality rates in different areas over the past few decades. Spending time thinking about how such a map might work paid off for Barry-Jester and her colleagues.
“Almost immediately, we were able to put it to use in other stories,” she explained. “Also, we can make nice static charts off of the interactive, so that’s just another way it can be repurposed.”