

By analyzing booking logs, I showed San Francisco jails are a revolving door with little treatment

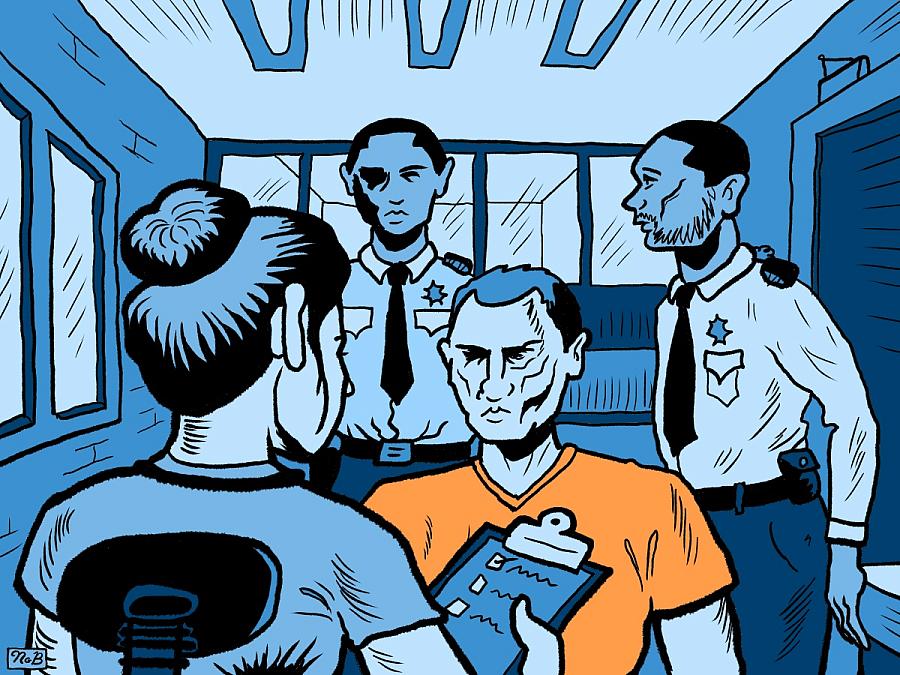
San Francisco’s Mayor Daniel Lurie made “breaking the cycle” of drug addiction and homelessness a priority of his first year in office. In 2025, the city stepped up enforcement against low-level crimes and expanded its jail health services. Still, people I met on the street kept telling me that they were cycling in and out of jail without adequate access to health care. As a Center for Health Journalism Data Fellow, I set out to quantify just how often this happened.
To do this, I needed data. I submitted public records requests to multiple city agencies requesting individualized jail booking and discharge logs. I also requested extensive data on addiction medications offered in the jail and referrals to community treatment programs upon release. No records were given to me. (After the stories were published, a source emailed to say that recidivism rates in San Francisco had not been publicized for seven years.)
It was time to get creative. Every day I received an email from the San Francisco Sheriff’s Department with a list of everyone who had been booked into jail the day prior. My newsroom’s data reporter helped scrape each email and compile a machine-readable dataset. This dataset did not reflect each individual’s criminal history, or how often they’d been arrested over their lifetime. But it could tell us about patterns over a shorter timeframe.
My senior data fellow, MaryJo Webster, helped me adapt my questions to fit the dataset I had. She suggested looking at how many times a “sample group” of people — everyone booked into jail for the first time that year in January — reappeared in the booking logs over the course of 12 months. As I ran this analysis in Python, more questions arose. Were people repeatedly booked for certain crimes more than others? Did any of the people who were booked into jail in 2025 later die of an overdose? Who were the people who’d been booked the most?
Some of these questions could be answered by “interviewing” the data, a skill we talked about often in our Data Fellowship workshops. For example, through a public records request, I was able to obtain the San Francisco Medical Examiner’s list of everyone in San Francisco who had died of an overdose in 2025. I searched both the booking log data and that list for overlapping names, and looked at how much time passed between each individual’s booking date and date of death.
Other questions were more qualitative, so I tracked down attorneys who could give me insight into individual cases, and help me “check” whether the statistics I’d produced reflected their internal data. One public defender confirmed that her client, a man who stood out in my analysis, had gone to jail 11 times in 2025.
My requests to spokespeople for interviews with jail health officials, staff of the sheriff’s department, and the mayor’s office were declined. So, again, I had to get creative about how I was going to capture the perspective of people working to provide health care in the city’s criminal justice system. A statement from the Department of Public Health in response to written questions gave me most of the summary statistics I’d been looking for. I then spoke to dozens of legal professionals, social workers, nurses, and doctors to paint a picture of the process.
To put a face to the numbers, the community engagement grant I received became critical. Every week, I spent an afternoon at a local community organization that offers food, harm reduction supplies, and a place to sleep during the day. Many people who came through were formerly incarcerated drug users, and I kept up with several of them over five months.
It was here that I met Sam, the main character of my two-part series. A volunteer nurse had just bandaged his wound, and texted me to run over: There was someone I should meet. Sam described at length his experiences in the jail. At the end of our interview, I asked what he was going to do later that day. Maybe get “the shot,” he said, referring to an opioid-use medication. I asked if I could come along. He said yes. Our journey is detailed in the second part of my series.
Right before the stories were supposed to be published, the sheriff’s department raised concerns that the booking logs I’d analyzed may not always accurately reflect a new criminal offense. A person might reappear in booking logs because of an administrative change. Or a person might be arrested simply because they failed to appear in court for a prior charge.
In response, my editor and I went through every paragraph of my stories to ensure I’d accurately captured what a booking log can and can’t tell us, then followed up each statistic with context from interviews I’d conducted. Getting arrested on a warrant, people told me, was often exactly the problem perpetuating their cycle of incarceration: Without stable housing or a cell phone, making it to court on time could feel impossible. Meanwhile, input from my senior data fellow, who had expertise editing similar projects, gave me confidence that the descriptions of my findings were accurate.
Persistent on-the-ground reporting gave life to my data analysis, and helped me feel confident that the trends I found accurately reflected people’s lived experiences. When I felt stuck, taking to the streets became my way to figure out what questions to ask next.