
How a data mystery on overdose deaths pushed me to learn coding and level up my skills

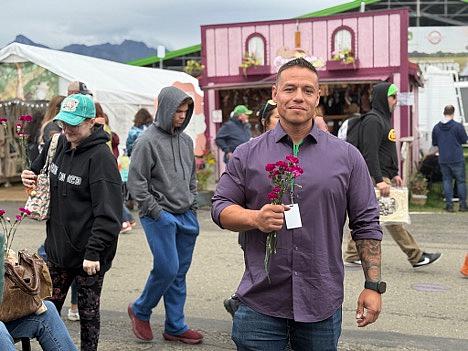
Sam Garcia, senior clinical outreach coordinator at Anchorage Recovery Center, holds purple flowers for overdose awareness day at the Alaska State Fair in Palmer, Alaska.
Photo by Hannah Harris Green
In September of 2024, I was looking for story ideas for The Guardian’s news desk when I noticed something unusual in the CDC’s latest overdose fatality data—antidepressants had been co-involved in as many overdose fatalities as heroin in 2022. I wasn’t sure what to make of this, but I knew I wanted to understand it. My news desk stories are typically quick turnaround pieces, but for this one, I found myself glued to my computer for days, searching for new sources of data and seeing hundreds of possible stories before my eyes in the numbers, which I tried to make sense of by manually entering them into Excel. It was time consuming and overwhelming.
Not much later, I met Matt Kiefer, a data journalism professor at Northwestern, at an IRE event in Chicago. We began discussing data journalism and overdoses, and how nobody seemed to know why they’d finally begun to decline. We talked about the variety of tools and datasets that could potentially illuminate this somewhat mysterious health crisis. A month after that, I was applying for epidemiology programs here in Chicago and taking an online Stanford statistics course to help bolster my applications. My talks with Matt and explorations of statistics made me realize that to really answer questions about the overdose crisis, I would need new skills—copy-pasting tables into Excel wasn’t going to cut it. Together, Matt and I decided to apply for a USC grant where we’d compare overdose fatalities and how much they’d declined across US counties. Matt’s initial comparison quickly surfaced large disparities across the US.
As I began pre-reporting for the project, I was also learning epidemiological tools like significance testing and R programming that I would use for my project. While I understand not everyone is in a position to get a STEM degree while working as a journalist, I wanted to use this project summary as an opportunity to highlight tips and advantages of incorporating more math and coding tools into everyday journalism.
Lesson 1: Consider learning some stats. Consider learning to code.
My personal experience as a journalist is that there can be a lot of ambivalence about crunching numbers in newsrooms. A lot of us haven’t had to do math since graduating high school. And a lot of us also went to school in environments where teachers doubted our math skills unless we belonged to specific identity categories. We wouldn’t be journalists if we weren’t good with words, and our teachers might have told us to focus on verbal skills.
If you are at all inclined, sharpening your math skills and developing coding skills can be a nice break from the constant verbal work of journalism, and can also make you stand apart. Journalists have done massive damage to public health by oversimplifying numbers and study findings, so any set of eyes that can detect mathematical nuances is helpful in a newsroom.
For example, sometimes medications, foods or other lifestyle factors are associated with increased risk for diseases in scientific studies. But sometimes the increase is small. For example, maybe a medication will increase risk of another illness from 1 in 100,000 to 3 in 100,000. Media outlets will report that factor X (say, taking Tylenol) triples risk, even when overall risk is still very low, creating panic when there may in fact be more benefit than risk to the product in question. This type of oversimplification has created damaging panic storms around hormone replacement therapy for menopause, for example, which actually prevents more illnesses than it causes in addition to alleviating some menopause symptoms.
When I began learning R programming for my epidemiology degree, I decided just to try loading datasets for the overdose project into R and see what I was able to do with them. R is a free, open source software. Free AI tools like Chat GPT and Perplexity make learning to code more accessible than it has ever been. Unlike with research or writing requests, if AI tools get something wrong when it comes to coding, the code [usually] simply will not work, so there is less danger of unchecked hallucinations, although of course you should find ways to double check anything final with colleagues.
Learning R helped me save more time than it wasted almost immediately. Coding makes it easier to reorganize spreadsheets and conduct calculations and tests with less risk of manual error. I was able to corroborate and build on the structure of Matt’s original county ranking with my own code, tie these rankings to other datasets, and run basic regressions to help pinpoint which trends might be most interesting.
Lesson 2: Find a question you really want to answer and make that your motivation to learn some new skills and find some new data
I doubt I would have learned R as quickly or as well as I did if I’d just been attending a class without my own project to motivate me. Not long ago, I was in the narrative podcasting world, where narrators say things like “I could not stop thinking about this question,” or “I became obsessed with this,” so much it’s a cliché. But when you find a question where this is actually true, and you need to learn some coding or statistical skills to actually answer that question, it’s the best motivation you can find for learning some new skills.
Don’t let the fact that you’re new to something make you think you’re not qualified to do the work. Just make sure you have someone with a bit more experience who can help you test your answers. In my case, I had Matt and The Guardian’s data and visuals editors to help me with fact checking.
The question in this case: What is actually causing the decline in US overdoses, and why is that decline so different across states? My early research combining scientific studies with expert interviews led me to believe that much of the answer to that question might lie in changes within the drug supply. But locally and temporally specific data on the drug supply is often not publicly available, where it exists at all.
I was able to scout out two data sources that helped me sharpen the picture. One, the DEA’s National Forensic Laboratory Information Systems data, was technically publicly available, but the way the database worked at the time I was trying to access it would have meant it would take me hours to download all the data, and that there would have been many opportunities for human error. I had to request the full dataset for weeks before the DEA finally shared it with me.
The other dataset came from Millennium Health, which analyzes substance use patients’ urine for accurate information about what drugs they have consumed—something that patients might not even know themselves given the volatility of today’s drug supply. Millenium Health works with researchers to try to illuminate drug supply trends, and were generous to me with their data.
Lesson 3: Once you learn to speak their language, scientists can be very generous with their time
Scientists and journalists have in common that curiosity drives their work. One major difference is that scientists are used to conducting research over years and years, while we journalists usually have much tighter turnarounds. Another major difference is that while journalists tend to value “scoops” or being the first to prevent new information, scientists value “consensus” or replicating the same findings over and over again. So there isn’t the same type of protectiveness over information that I often find in journalism.
All of this means that if you are able to provide some new insight in a format they understand, scientists can be great background sources to help you confirm and further dig into your findings. When I began organizing the Millenium Health and NFLIS data on the drug supply to create mock ups for time series visualizations and run statistical analysis, I was able to share those analyses with scientists who have PhDs and MDs. They were happy to help find answers in their field, and I was able to benefit from their expertise and gut check my findings.
Lesson 4: Treat field reporting planning like you’re producing a major event
This one isn’t science related.
When I was planning my reporting trip in Alaska for this series, I was very nervous about getting everything I needed. This led me to think back to the skills I’d learned in my former life as a podcast producer—which basically boil down to this: overplan everything, but also leave some time open for side quests.
I began making a list of interviews I wanted to get over a month in advance of my trip. I also made sure there would be events for me to cover. Luckily, overdose awareness day is August 31, and there were a number of events that made sense for the story, including a naloxone kit build and a political round table at a youth recovery organization. Once I’d figured out my dates, I made inquiries about other ways I could cover the crisis, like going out into homeless encampments with a harm reduction organization delivering safer drug use supplies, and riding along with a crisis intervention team that helps people who are facing a mental health crisis while intoxicated. I also had enough time to figure a way around the fact that certain public information officers were ignoring my calls.
I was very glad I overplanned for my trip, not only because it meant I was able to get all the interviews I wanted for my story, but also because it meant that most of the stress of the trip happened before I got there, which was essential to allow me to focus on the emotionally heavy topic of overdose fatalities.